Earlier, I shared an overview of acceptance sampling. Now we'll look at how to do acceptance sampling by variables, facilitated by the tools in Minitab Statistical Software. If you're not already using it and you'd like to follow along, you can get the free 30-day trial version.
In contrast to acceptance sampling by attributes, where inspectors make judgment calls about defective items, acceptance sampling by variables involves the evaluating sampled items on properties that can be measured—for example, the diameter of a hole in a circuit board, or the length of a camshaft.
When you go to Quality > Acceptance Sampling by Variables you will find two options to select from.

Create / Compare lets you either create a new sampling plan or compare several different ones. Accept / Reject lets you evaluate and make an acceptance decision about a batch of items based on data you've collected according to a sampling plan.
In this post, we'll look at what you can do with the Create / Compare tools.
Creating a Plan for Acceptance Sampling by Variables
Suppose your electronics company receives monthly shipments of 1,500 LEDs, which are used to indicate whether a device is switched on or off. The soldering leads that go through the devices' circuit boards need to be a certain length. You want to use acceptance sampling to verify the length of the soldering leads.
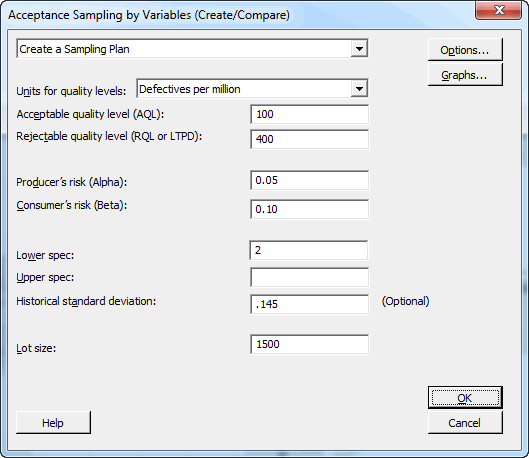
Select Stat > Quality Tools > Acceptance Sampling by Variables >Create / Compare, then choose Create a sampling plan. Since we're creating and comparing variable sampling plans, we don't need any real data yet. Instead, we'll just enter information about our process into the dialog box, which you can fill out as shown below.

For Units for quality levels, choose the appropriate units for your measurement type. You and your supplier have agreed to use defectives per million to represent the number of defectives in your sample.
You and your supplier also have agreed on the poorest process average that would be an Acceptable quality level (AQL), as well as the poorest average you will tolerate before a lot reaches the Rejectable quality level (RQL or LTDP). You and the supplier agree that for LEDs, the AQL is 100 defectives per million, and the RQL is 400 defectives per million
You set the probability of accepting a poor lot (Consumer's risk) at 10 percent, and the chances of rejecting a good lot (Producer's risk) at 5 percent.
You also can enter upper and/or lower specification for your measured property, as well as optionally the historical standard deviation of your process. The lower specification for your LEDs leads is 2 cm.
The lot size refers to the entire population of units that the sample will be taken from. In this case, the size of your monthly LED shipment is 1500.
Interpreting Your Acceptance Sampling Plan
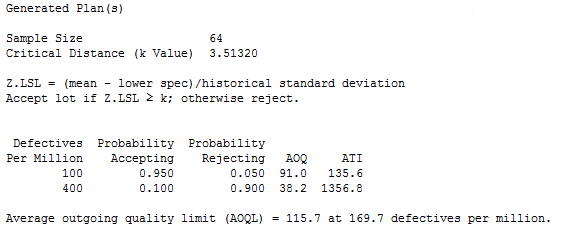
After you complete the dialog box as shown above and click OK, Minitab produces the following output in the Session Window.

You need to randomly select and inspect 64 items from each batch of 1500 LEDs. You'll use the mean and standard deviation of your random sample to calculate the Z value, where Z = (mean - lower spec)/ standard deviation. You also can use historical data about the standard deviation, if available.
If Z.LSL is greater than the critical distance, in this case k = 3.51320, you can accept the entire batch of LEDs. If the Z value is less than the critical distance, reject the shipment.
The probability of accepting a shipment at the AQL is 95%, and when the sampling plan was set up, you and your supplier agreed that lots of 100 defectives per million would be accepted approximately 95% of the time. You also have a 90% probability of rejecting a batch of LEDs at the RQL. This fits your agreement with the supplier that lots with 400 defectives per million would be rejected most of the time for your protection.
If, after a lot is rejected, the supplier's corrective action is to perform 100% inspection and rework any defective items, the Average Outgoing Quality (AOQ) represents the average quality of the lot and the Average Total Inspection (ATI) represents the average number of inspected items after additional screening.
The Average Outgoing Quality (AOQ) level is 91 defectives per million at the AQL and 38.2 defectives per million at the RQL. As we discussed in the overview of acceptance sampling, this is because outgoing quality will be good for lots that are either very good to begin with, or that undergo rework and reinspection due to a poor initial inspection. The Average outgoing quality limit (AOQL) represents the worst-case outgoing quality level, which usually occurs when a batch is neither very good nor very bad.
The Average Total Inspection (ATI) per lot represents the average number of LEDs inspected at a particular quality level and probability of acceptance. For the quality level of 100 defectives per million, the average total of inspected LEDs per lot is 135.6. For the quality level of 400 defectives per million, the average total number of items inspected is 1356.8.
You believe this is a reasonable and acceptable plan to follow, but your supervisor isn't sure, and asks you to see how this plan stacks up against some other possible options. I'll show you how to do that in my next post.


