


Maybe you're just getting started with analyzing data. Maybe you're reasonably knowledgeable about statistics, but it's been a long time since you did a particular analysis and you feel a little bit rusty. In either case, the Assistant menu in Minitab Statistical Software gives you an interactive guide from start to finish. It will help you choose the right tool quickly, analyze your data properly, and even interpret the results appropriately.
One type of analysis many practitioners struggle with is multiple regression analysis, particularly an analysis that aims to optimize a response by finding the best levels for different variables. In this post, we'll use the Assistant to complete a multiple regression analysis and optimize the response.
Identifying the Right Type of Regression
In our example, we'll use a data set based on some solar energy research. Scientists found the position of focal points could be used to predict total heat flux. The goal of our analysis will be to use the Assistant to find the ideal position for these focal points.
When you select Assistant > Regression in Minitab, the software presents you with an interactive decision tree. If you need more explanation about a decision point, just click on the diamonds to see detailed information and examples.
This data set has three X variables, or predictors, and we're looking to fit a model and optimize the response. For this goal, the tree leads to the Optimize Response button located at the bottom right. Clicking that button brings up a simple dialog box to complete.
HeatFlux is the response variable. The X variables are the focal points located in each direction, East, West, North, and South. Based on previous knowledge, we know we should use 234 as the target heat flux value of 234, but we could also ask the Assistant to maximize or minimize the response. Because we checked the box labeled "Fit 2-way interactions and quadratic terms," the Assistant also will check for curvature and interactions.
When we press "OK," the Assistant quickly generates a regression model for the X variables using stepwise regression. It presents the results in a series of reports written in plain, easy-to-follow language.
Get the most out of your Minitab experience. Check out our training options!
Summary Report
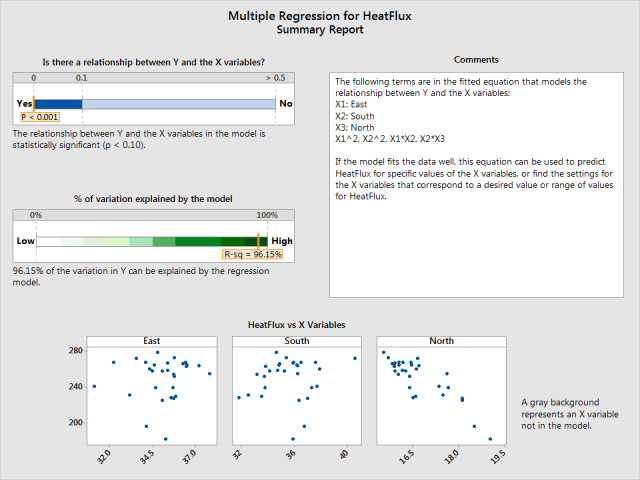
This Summary Report delivers the "big picture" about the analysis and its results. With a p-value less than 0.001, this report shows that the regression model is statistically significant, with an R-squared value of 96.15%! The comments window shows which X variables the model includes: East, South, and North, as well as interaction terms. To model curvature, the model also includes several polynomial terms.
Effects Report
The Effects Report shows all of the interaction and main effects included in the model. The presence of curved lines indicates the Assistant used a polynomial term to fit a curve.
In this report, the East*South interaction is significant. This means the effect of one variable on heat flux varies based on the other variable. If South has a low setting (31.84), heat flux is reduced by increasing East. But if South is set high (40.55), the heat flux increases as East gets higher.
Diagnostic Report
The Diagnostic Report shows you the plot of residuals versus fitted values, and indicates any unusual points that ought to be investigated. This report has flagged two points, but these are not necessarily problematic, since based on the criteria for large residuals we'd expect roughly 5% of the observations to be flagged. The report also identifies two points that had unusual X values; clicking the points reveals which worksheet row they are in.
Model Building Report
The Model Building Report details how the Assistant arrived at the final regression model. It also contains the regression equation, identifies the variables that contribute the most information, and indicates whether the X variables are correlated. In this model, North contributes the most information. Even though East is not significant, since it is part of a higher-order term the Assistant includes it.
This is a good opportunity to point out how The Assistant helps ensure that an analysis is done in the best way. For example, the Assistant uses standardized X variables to create the regression model. That's because standardizing the X variables removes most of the correlation between linear and higher-order terms, which reduces the chance of adding these terms to your model if they aren't needed. However, the Assistant still displays the final model in natural (unstandardized) units.
Prediction and Optimization Report
The Assistant's Prediction and Optimization Report provides solutions for obtaining the targeted heat flux value of 234. The optimal settings for the focal points have been identified as East 37.82, South 31.84, and North 16.01. The model predicts that these settings will deliver a heat flux of 234, with a prediction interval of 216 to 252. But the Assistant provides alternate solutions you may want to consider, particularly in cases where specialized subject area expertise might be critical.
Report Card
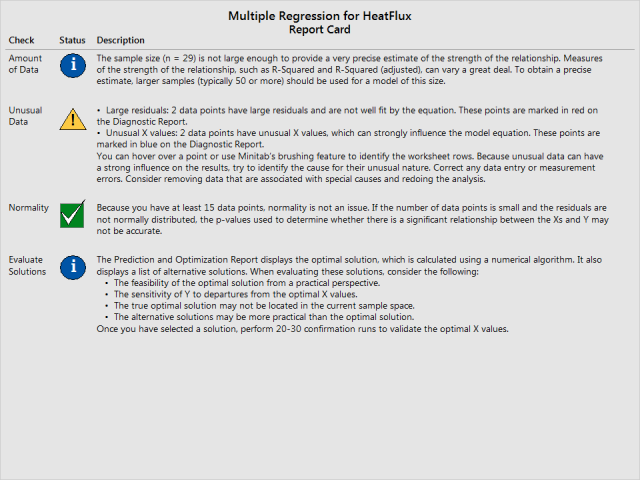
Finally, the Report Card prevents you from missing potential problems that could make your results unreliable. In this case, the report suggests collecting a larger sample and investigating the unusual residuals. It also shows that normality is not an issue for these data. Finally, it provides a helpful reminder to validate the model's optimal values by doing confirmation runs.
The Assistant's methods are based on established statistical practice, guidelines in the literature, and simulations performed by Minitab's statisticians. You can read the technical white paper for Multiple Regression in the Assistant if you would like all the details.
Get a free trial of Minitab Statistical Software today!