


You've collected a bunch of data. It wasn't easy, but you did it. Yep, there it is, right there...just look at all those numbers, right there in neat columns and rows. Congratulations.
I hate to ask...but what are you going to do with your data?
If you're not sure precisely what to do with the data you've got, graphing it is a great way to get some valuable insight and direction. And a good graph to start with is an individual value plot, which you can create in Minitab Statistical Software by going to Graph > Individual Value Plot.
How can individual value plots help me?
There are other graphs you could start with, so what makes the individual value plot such a strong contender? That fact it lets you view important data features, find miscoded values, and identify unusual cases.
In other words, taking a look at an individual value plot can help you to choose the appropriate direction for your analysis and to avoid wasted time and frustration.
IDENTIFY INDIVIDUAL VALUES
Many people like to look at their data in boxplots, and you can learn many valuable things from those graphs. Unlike boxplots, individual value plots display all data values and may be more informative than boxplots for small amounts of data.
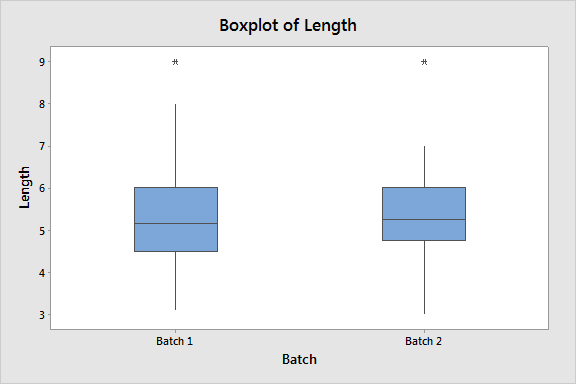
The boxplots for the two variables look identical.
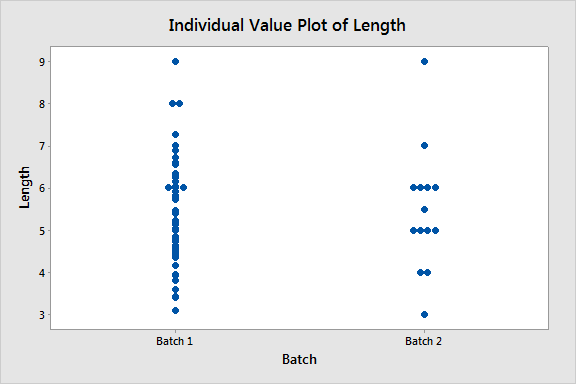
The individual value plot of the same data shows that there are many more values for Batch 1 than for Batch 2.
You can use individual value plots to identify possible outliers and other values of interest. Hover the cursor over any point to see its exact value and position in the worksheet.
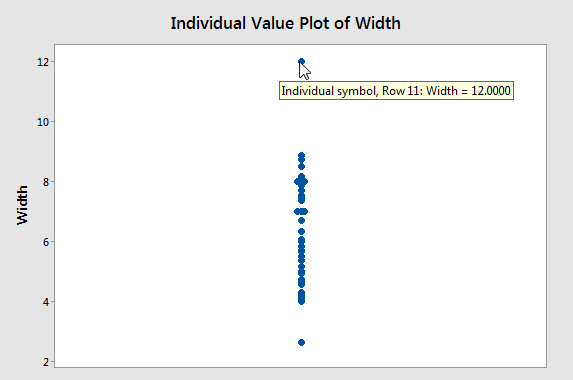
Individual value plots can also clearly illustrate characteristics of the data distribution. In this graph, most values are in a cluster between 4 and 10. Minitab can jitter (randomly nudge) the points horizontally, so that one value doesn’t obscure another. You can edit the plot to turn on or turn off jitter.
MAKE GROUP COMPARISONS
Because individual value plots display all values for all groups at the same time, they are especially helpful when you compare variables, groups, and even subgroups.
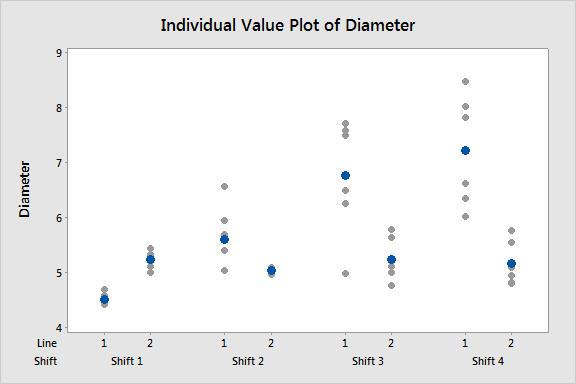
This plot shows the diameter of pipes from two lines over four shifts. You can see that the diameters of pipes produced by Line 1 seem to increase in variability across shifts, while the diameters of pipes from Line 2 appear more stable.
SUPPORT OTHER ANALYSES
An individual value plot is one of the built-in graphs that are available with many Minitab statistical analyses. You can easily display an individual value plot while you perform these analyses. In the analysis dialog box, simply clickGraphs and check Individual Value Plot.
Some built-in individual value plots include specific analysis information. For example, the plot that accompanies a 1-sample t-test displays the 95% confidence interval for the mean and the reference value for the null hypothesis mean. These plots give you a graphical representation of the analysis results.
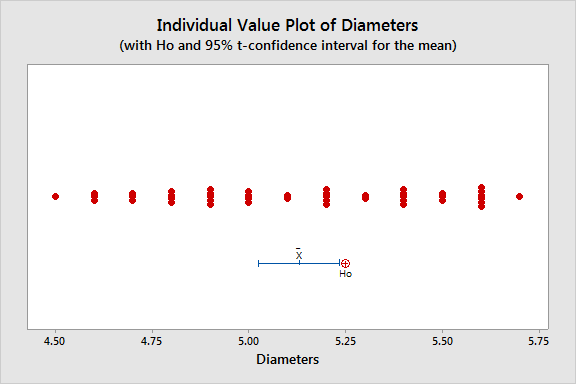
This plot accompanies a 1-sample t-test. All of the data values are between 4.5 and 5.75. The reference mean lies outside of the confidence interval, which suggests that the population mean differs from the hypothesized value.
Individual Value Plot: A Case Study
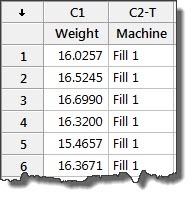
Suppose that salad dressing is bottled by four different machines and that you want to make sure that the bottles are filled correctly to 16 ounces. You weigh 30 samples from each machine. You plan to run an ANOVA to see if the means of the samples from each machine are equal. But, first, you display an individual value plot of the samples to get a better understanding of the data.
Choose Graph > Individual Value Plot.
Under One Y, choose With Groups.
Click OK.
In Graph variables, enter Weight.
In Categorical variables for grouping, enter Machine.
Click Data View.
Under Data Display, check Interval bar and Mean symbol.
Click OK in each dialog box.
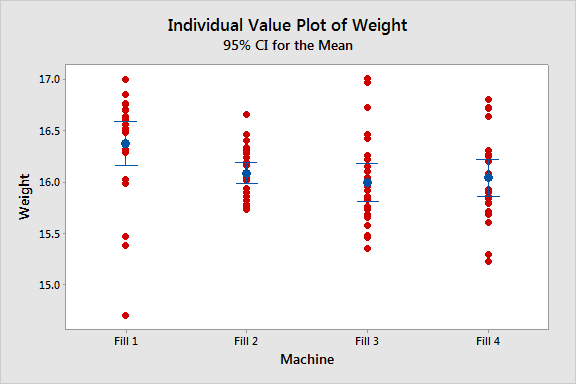
The mean fill weight is about 16 ounces for Fill2, Fill3, and Fill4, with no suspicious data points. For Fill1, however, the mean appears higher, with a possible outlier at the lower end.
Before you continue with the analysis, you may want to investigate problems with the Fill1 machine.
Putting individual value plots to use
Use Minitab’s individual value plot to get a quick overview of your data before you begin your analysis—especially if you have a small data set or if you want to compare groups. The insight that you gain can help you to decide what to do next and may save you time exploring other paths.
For more information on individual value plots and other Minitab graphs, see Minitab Help.