


Confidence Interval in statistics, as in life, absolute certainty is rare. That's why statisticians often can't provide a result that is as specific as we might like; instead, they provide the results of an analysis as a range, within which the data suggest the true answer lies.
Most of us are familiar with "confidence intervals," but that's just of several different kinds of intervals we can use to characterize the results of an analysis. Sometimes, confidence intervals are not the best option. Let's look at the characteristics of some different types of intervals, and consider when and where they should be used. Specifically, we'll look at confidence intervals, prediction intervals, and tolerance intervals.
An Overview of Confidence Intervals
 A confidence interval refers to a range of values that is likely to contain the value of an unknown population parameter, such as the mean, based on data sampled from that population.
Collected randomly, two samples from a given population are unlikely to have identical confidence intervals. But if the population is sampled again and again, a certain percentage of those confidence intervals will contain the unknown population parameter. The percentage of these confidence intervals that contain this parameter is the confidence level of the interval.
Confidence intervals are most frequently used to express the population mean or standard deviation, but they also can be calculated for proportions, regression coefficients, occurrence rates (Poisson), and for the differences between populations in hypothesis tests.
If we measured the life of a random sample of light bulbs and Minitab calculates 1230 - 1265 hours as the 95% confidence interval, that means we can be 95% confident the mean for the population of bulbs falls between 1230 and 1265 hours.
In relation to the parameter of interest, confidence intervals only assess sampling error—the inherent error in estimating a population characteristic from a sample. Larger sample sizes will decrease the sampling error, and result in smaller (narrower) confidence intervals. If you could sample the entire population, the confidence interval would have a width of 0: there would be no sampling error, since you have obtained the actual parameter for the entire population!
In addition, confidence intervals only provide information about the mean, standard deviation, or whatever your parameter of interest happens to be. It tells you nothing about how the individual values are distributed.
What does that mean in practical terms? It means that the confidence interval has some serious limitations. In this example, we can be 95% confident that the mean of the light bulbs will fall between 1230 and 1265 hours. But that 95% confidence interval does not indicate that 95% of the bulbs will fall in that range. To draw a conclusion like that requires a different type of interval...
An Overview of Prediction Intervals
A prediction interval is a confidence interval for predictions derived from linear and nonlinear regression models. There are two types of prediction intervals.
Confidence interval of the prediction
Given specified settings of the predictors in a model, the confidence interval of the prediction is a range likely to contain the mean response. Like regular confidence intervals, the confidence interval of the prediction represents a range for the mean, not the distribution of individual data points.
With respect to the light bulbs, we could test how different manufacturing techniques (Slow or Quick) and filaments (A or B) affect bulb life. After fitting a model, we can use statistical software to forecast the life of bulbs made using filament A under the Quick method.
If the confidence interval of the prediction is 1400–1450 hours, we can be 95% confident that the mean life for bulbs made under those conditions falls within that range. However, this interval doesn't tell us anything about how the lives of individual bulbs are distributed.
Prediction interval
A prediction interval is a range that is likely to contain the response value of an individual new observation under specified settings of your predictors.
If Minitab calculates a prediction interval of 1350–1500 hours for a bulb produced under the conditions described above, we can be 95% confident that the lifetime of a new bulb produced with those settings will fall within that range.
You'll note the prediction interval is wider than the confidence interval of the prediction. This will always be true, because additional uncertainty is involved when we want to predict a single response rather than a mean response.
An Overview of Tolerance Intervals
A tolerance interval is a range likely to contain a defined proportion of a population. To calculate tolerance intervals, you must stipulate the proportion of the population and the desired confidence level—the probability that the named proportion is actually included in the interval. This is easier to understand when you look at an example.
Tolerance interval example
To assess how long their bulbs last, the light bulb company samples 100 bulbs randomly and records how long they last.
To use this data to calculate tolerance intervals, go to Stat > Quality Tools > Tolerance Intervals in Minitab. (If you don't already have it, download the free 14-day trial of Minitab and follow along!) Under Data, choose Samples in columns. In the text box, enter Hours. Then click OK.
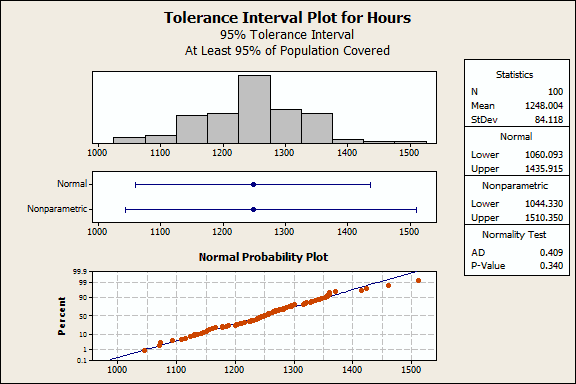
The normality test indicates that these data follow the normal distribution, so we can use the Normal interval (1060 1435). The bulb company can be 95% confident that at least 95% of all bulbs will last between 1060 to 1435 hours.
How tolerance intervals compare to confidence intervals
As we mentioned earlier, the width of a confidence interval depends entirely on sampling error. The closer the sample comes to including the entire population, the smaller the width of the confidence interval, until it approaches zero.
But a tolerance interval's width is based not only on sampling error, but also variance in the population. As the sample size approaches the entire population, the sampling error diminishes and the estimated percentiles approach the true population percentiles.
Minitab calculates the data values that correspond to the estimated 2.5th and 97.5th percentiles (97.5 - 2.5 = 95) to determine the interval in which 95% of the population falls. You can get more details about percentiles and population proportions here for more information about percentiles and population proportions.
Of course, because we are using a sample, the percentile estimates will have error. Since we can't say that a tolerance interval truly contains the specified proportion with 100% confidence, tolerance intervals have a confidence level, too.
How tolerance intervals are used
Tolerance intervals are very useful when you want to predict a range of likely outcomes based on sampled data.
In quality improvement, practitioners generally require that a process output (such as the life of a light bulb) falls within spec limits. By comparing client requirements to tolerance limits that cover a specified proportion of the population, tolerance intervals can detect excessive variation. A tolerance interval wider than the client's requirements may indicate that product variation is too high.
Minitab statistical software makes obtaining these intervals easy, regardless of which one you need to use for your data.
Try Minitab now for free!

Let our experts teach you how to unlock the potential of your company's data. Learn about our Training Services today!