Just how high should R2 be in regression analysis? I hear this question asked quite frequently.
Previously, I showed how to interpret R-squared (R2). I also showed how it can be a misleading statistic because a low R-squared isn’t necessarily bad and a high R-squared isn’t necessarily good.
Clearly, the answer for “how high should R-squared be” is . . . it depends.
In this post, I’ll help you answer this question more precisely. However, bear with me, because my premise is that if you’re asking this question, you’re probably asking the wrong question. I’ll show you which questions you should actually ask, and how to answer them.
Why It’s the Wrong Question
How high should R-squared be? There’s only one possible answer to this question. R2 must equal the percentage of the response variable variation that is explained by a linear model, no more and no less.
When you ask this question, what you really want to know is whether your regression model can meet your objectives. Is the model adequate given your requirements?
I’m going to help you ask and answer the correct questions. The questions depend on whether your major objective for the linear regression model is:
- Describing the relationship between the predictors and response variable, or
- Predicting the response variable
R-squared and the Relationship between the Predictors and Response Variable
This one is easy. If your main goal is to determine which predictors are statistically significant and how changes in the predictors relate to changes in the response variable, R-squared is almost totally irrelevant.
If you correctly specify a regression model, the R-squared value doesn’t affect how you interpret the relationship between the predictors and response variable one bit.
Suppose you model the relationship between Input and Output. You find that the p-value for Input is significant, its coefficient is 2, and the assumptions pass muster.
These results indicate that a one-unit increase in Input is associated with an average two-unit increase in Output. This interpretation is correct regardless of whether the R-squared value is 25% or 95%!
See a graphical illustration of why a low R-squared doesn't affect this interpretation.
Asking “how high should R-squared be?” doesn’t make sense in this context because it isn’t relevant. A low R-squared doesn’t negate a significant predictor or change the meaning of its coefficient. R-squared is simply whatever value it is, and it doesn’t need to be any particular value to allow for a valid interpretation.
In order to trust your interpretation, which questions should you ask instead?
- Is there a sound rationale for my model and do the results fit theory?
- Can I trust my data?
- Do the residual plots and other assumptions look good?
- How do I interpret the p-values and regression coefficients?
R-squared and Predicting the Response Variable
If your main goal is to produce precise predictions, R-squared becomes a concern. Predictions aren’t as simple as a single predicted value because they include a margin of error; more precise predictions have less error.
R-squared enters the picture because a lower R-squared indicates that the model has more error. Thus, a low R-squared can warn of imprecise predictions. However, you can’t use R-squared to determine whether the predictions are precise enough for your needs.
That’s why “How high should R-squared be?” is still not the correct question.
Which questions should you ask? In addition to the questions above, you should ask:
- Are the prediction intervals precise enough for my requirements?
Don’t worry, Minitab Statistical Software makes this easy to assess.
Prediction intervals and precision
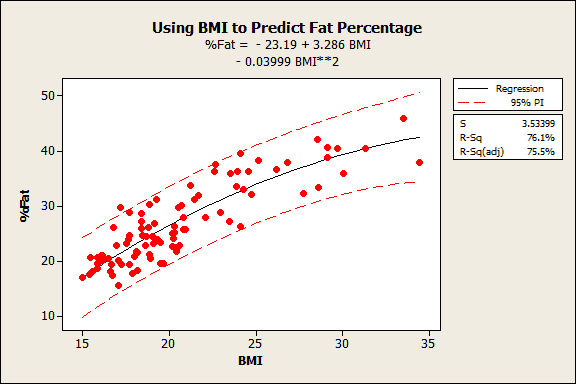
A prediction interval represents the range where a single new observation is likely to fall given specified settings of the predictors. These intervals account for the margin of error around the mean prediction. Narrower prediction intervals indicate more precise predictions.
 For example, in my post where I use BMI to predict body fat percentage, I find that a BMI of 18 produces a prediction interval of 16-30% body fat. We can be 95% confident that this range includes the value of the new observation.
You can use subject area knowledge, spec limits, client requirements, etc to determine whether the prediction intervals are precise enough to suit your needs. This approach directly assesses the model’s precision, which is far better than choosing an arbitrary R-squared value as a cut-off point.
For the body fat model, I’m guessing that the range is too wide to provide clinically meaningful information, but a doctor would know for sure.
Read about how to obtain and use prediction intervals.
R-squared Is Overrated!
When you ask, “How high should R-squared be?” it’s probably because you want to know whether your regression model can meet your requirements. I hope you see that there are better ways to answer this than through R-squared!
R-squared gets a lot of attention. I think that’s because it appears to be a simple and intuitive statistic. I’d argue that it’s neither; however, that’s not to say that R-squared isn’t useful at all. For instance, if you perform a study and notice that similar studies generally obtain a notably higher or lower R-squared, it would behoove you to investigate why yours is different.
In my next blog, read how S, the standard error of the regression, is a different goodness-of-fit statistic that can be more helpful than R-squared.
If you're just learning about regression, read my regression tutorial!


