---
title: How to Compare Regression Slopes
description: How to Compare Regression Slopes
image: https://blog.minitab.com/hubfs/B2BML%20-%20NEW%20FILE%20MANAGER%20STRUCTURE/Blog%20Images/Imported_Blog_Media/scatter_constant_dift-Jul-05-2025-11-28-44-5442-PM.png
---
English
- [English](https://blog.minitab.com/en/?hsLang=en)
- [Français](https://blog.minitab.com/fr/?hsLang=en)
- [Deutsch](https://blog.minitab.com/de/?hsLang=en)
- [Português](https://blog.minitab.com/pt/?hsLang=en)
- [Español](https://blog.minitab.com/es/?hsLang=en)
- [日本語](https://blog.minitab.com/ja/?hsLang=en)
- [한국어](https://blog.minitab.com/ko/?hsLang=en)
- [中文(简体)](https://blog.minitab.com/zh/?hsLang=en)
- [ Partners](https://www.minitab.com/en-us/company/partners/)
- [ Contact](https://www.minitab.com/en-us/company/contact-us/)
- [ Talk to Minitab](https://www.minitab.com/en-us/talk-to-minitab/)
- [ My Account](https://licensing.minitab.com/account/manage)
[](https://www.minitab.com/en-us/)
- Products
Back
[Products](https://www.minitab.com/en-us/products/)
[All Products](https://www.minitab.com/en-us/products/)
- [Minitab Solution Center](https://www.minitab.com/en-us/products/minitab-solution-center/)
- [Minitab Statistical Software](https://www.minitab.com/en-us/products/minitab/)
- [Minitab Connect](https://www.minitab.com/en-us/products/connect/)
- [Minitab Model Ops](https://www.minitab.com/en-us/products/model-ops/)
- [Minitab Education Hub](https://www.minitab.com/en-us/products/education-hub/)
- [Minitab Engage](https://www.minitab.com/en-us/products/engage/)
- [Minitab Workspace](https://www.minitab.com/en-us/products/workspace/)
- [Real-Time SPC](https://www.minitab.com/en-us/products/real-time-spc/)
- [Prolink Data Collection & SPC](https://www.minitab.com/en-us/products/prolink)
- [Simul8 Discrete Event Simulation](https://info.minitab.com/en/new-to-simul8?hsLang=en)
- [SPM](https://www.minitab.com/en-us/products/spm/)
- Solutions
Back
[Solutions](https://www.minitab.com/en-us/solutions/)
[All Solutions](https://www.minitab.com/en-us/solutions/)
- [Analytics](https://www.minitab.com/en-us/solutions/analytics/)
- [Statistics & Predictive Analytics](https://www.minitab.com/en-us/solutions/analytics/statistical-analysis-predictive-analytics/)
- [Data Science & Machine Learning](https://www.minitab.com/en-us/solutions/analytics/data-science-machine-learning/)
- [Business Analytics & Intelligence](https://www.minitab.com/en-us/solutions/analytics/business-analytics-intelligence/)
- [Statistical Process Control](https://www.minitab.com/en-us/solutions/analytics/statistical-process-control/)
- [Quality Analytics](https://www.minitab.com/en-us/solutions/analytics/quality-analytics/)
- [Live Analytics](https://www.minitab.com/en-us/solutions/analytics/live-analytics/)
- [Reliability & Life Data Analysis](https://www.minitab.com/en-us/solutions/analytics/reliability/)
- [Discrete Event Simulation](https://info.minitab.com/en/new-to-simul8?hsLang=en)
- [Process Mining](https://info.minitab.com/en/new-to-simul8?hsLang=en)
- [Key Capabilities](https://www.minitab.com/en-us/solutions/key-capabilities/)
- [Continuous Improvement](https://www.minitab.com/en-us/solutions/key-capabilities/continuous-improvement/)
- [Data Integration & Data Prep](https://www.minitab.com/en-us/solutions/key-capabilities/data-integration-data-prep/)
- [Diagramming & Mind Mapping](https://www.minitab.com/en-us/solutions/key-capabilities/diagramming-mind-mapping/)
- [Digital Twins](https://info.minitab.com/en/new-to-simul8?hsLang=en)
- [Model Deployment & ML Ops](https://www.minitab.com/en-us/solutions/key-capabilities/model-deployment-ml-ops/)
- [Innovation & Project Management](https://www.minitab.com/en-us/solutions/key-capabilities/innovation-project-management/)
- [Process Excellence: Detect, Correct & Prevent](https://www.minitab.com/en-us/solutions/key-capabilities/process-excellence/)
- [Featured Industries](https://www.minitab.com/en-us/solutions/industry/)
- [Academic](https://www.minitab.com/en-us/solutions/industry/academic/)
- [Energy & Natural Resources](https://www.minitab.com/en-us/solutions/industry/energy-resources/)
- [Government & Public Sector](https://www.minitab.com/en-us/solutions/industry/government/)
- [Healthcare](https://www.minitab.com/en-us/solutions/industry/healthcare/)
- [Insurance](https://www.minitab.com/en-us/solutions/industry/insurance/)
- [Manufacturing & Industrial](https://www.minitab.com/en-us/solutions/industry/manufacturing-industrial/)
- [Services](https://www.minitab.com/en-us/solutions/industry/service-industries/)
- [Software & Technology](https://www.minitab.com/en-us/solutions/industry/software-technology/)
- [Construction](https://www.minitab.com/en-us/solutions/industry/construction/)
- [Featured Roles](https://www.minitab.com/en-us/solutions/role/)
- [Engineering](https://www.minitab.com/en-us/solutions/role/engineering/)
- [Business Analysis](https://www.minitab.com/en-us/solutions/role/business-analysts/)
- [Information Technology](https://www.minitab.com/en-us/solutions/role/information-technology/)
- [Supply Chain](https://www.minitab.com/en-us/solutions/role/supply-chain/)
- [Customer Service & Contact Center](https://www.minitab.com/en-us/solutions/role/customer-service-contact-center/)
- [Human Resources](https://www.minitab.com/en-us/solutions/role/human-resources/)
- [Marketing](https://www.minitab.com/en-us/solutions/role/marketing/)
- [Research and Development](https://www.minitab.com/en-us/solutions/role/research-and-development/)
- Resources & Services
Back
[Resources & Services](https://www.minitab.com/en-us/resources-services/)
[All Resources & Services](https://www.minitab.com/en-us/resources-services/)
- [Resources](https://www.minitab.com/en-us/resources-services/resources/)
- [Case Studies](https://www.minitab.com/en-us/resources-services/resources/case-studies/)
- [eBooks & White Papers](https://www.minitab.com/en-us/resources-services/resources/ebooks-and-white-papers/)
- [Blog](https://blog.minitab.com/blog/?hsLang=en)
- [Data Sets](https://www.minitab.com/en-us/resources-services/resources/data-set/)
- [Webinars & Events](https://www.minitab.com/en-us/resources-services/resources/events/)
- [Education Hub](https://www.minitab.com/en-us/resources-services/resources/education-hub/)
- [Services](https://www.minitab.com/en-us/resources-services/services/)
- [Training](https://www.minitab.com/en-us/resources-services/services/training/)
- [Deployment](https://www.minitab.com/en-us/resources-services/services/deployment/)
- [Consulting](https://www.minitab.com/en-us/resources-services/services/statistical-consulting/)
- [Self-Paced Learning](https://www.minitab.com/en-us/resources-services/services/self-paced-learning/)
- [Continuing Education](https://www.minitab.com/en-us/resources-services/services/continuing-education/)
- Support
Back
[Support](https://www.minitab.com/en-us/support/)
[Technical Support](https://www.minitab.com/en-us/support/)
- [Subscriptions & Activation](https://www.minitab.com/en-us/support/subscriptions-and-activation/)
- [Minitab Quick Start](https://www.minitab.com/en-us/support/quick-start/)
- [Training](https://www.minitab.com/en-us/resources-services/services/training/)
- [Installation Support](https://www.minitab.com/en-us/support/installation/)
- [Support Videos](https://www.minitab.com/en-us/support/videos/)
- [Support Documentation](https://www.minitab.com/en-us/support/documents/)
- [Software Updates](https://www.minitab.com/en-us/support/software-updates/)
- [Product Downloads](https://www.minitab.com/en-us/support/downloads/)
- [Support Policy](https://www.minitab.com/en-us/support/policy/)
- Company
Back
[Company](https://www.minitab.com/en-us/company/)
[Company](https://www.minitab.com/en-us/company/)
- [About Us](https://www.minitab.com/en-us/company/our-company/)
- [Leadership Team](https://www.minitab.com/en-us/company/leadership-team/)
- [Partners](https://www.minitab.com/en-us/company/partners/)
- [Careers](https://www.minitab.com/en-us/company/careers/)
- [Contact](https://www.minitab.com/en-us/company/contact-us/)
- [News](https://www.minitab.com/en-us/company/press-releases/)
[Try/Buy](https://www.minitab.com/en-us/try-buy/)
- [Statistics](https://blog.minitab.com/en/blog/tag/statistics)
- [Data Analysis](https://blog.minitab.com/en/blog/tag/data-analysis)
-
- [Quality Improvement](https://blog.minitab.com/en/blog/tag/quality-improvement)
- [Subscribe](https://info.minitab.com/blog/subscribe?hsLang=en)

## Notice
You are now leaving minitab.com.
Click Continue to proceed to:
Continue
Go Back
# How to Compare Regression Slopes
Minitab Blog Editor | 1/13/2016
Topics: [Data Analysis](https://blog.minitab.com/en/blog/tag/data-analysis), [Regression Analysis](https://blog.minitab.com/en/blog/tag/regression-analysis), [Hypothesis Testing](https://blog.minitab.com/en/blog/tag/hypothesis-testing)
- [Share](https://www.linkedin.com/shareArticle?mini=true&url=https://blog.minitab.com/en/blog/adventures-in-statistics-2/how-to-compare-regression-lines-between-different-models)
- [Share](https://www.facebook.com/sharer.php?u=https://blog.minitab.com/en/blog/adventures-in-statistics-2/how-to-compare-regression-lines-between-different-models)
If you perform linear regression analysis, you might need to compare different regression lines to see if their constants and slope coefficients are different. Imagine there is an established relationship between X and Y. Now, suppose you want to determine whether that relationship has changed. Perhaps there is a new context, process, or some other qualitative change, and you want to determine whether that affects the relationship between X and Y.
For example, you might want to assess whether the relationship between the height and weight of football players is significantly different than the same relationship in the general population.
You can graph the regression lines to visually compare the slope coefficients and constants. However, you should also statistically test the differences. [Hypothesis testing](https://blog.minitab.com/blog/adventures-in-statistics/understanding-hypothesis-tests%3A-why-we-need-to-use-hypothesis-tests-in-statistics?hsLang=en) helps separate the true differences from the random differences caused by sampling error so you can have more confidence in your findings.
In this blog post, I’ll show you how to compare a relationship between different regression models and determine whether the differences are statistically significant. Fortunately, these tests are easy to do using [Minitab Statistical Software](http://www.minitab.com/en-us/products/minitab/).
In the example I’ll use throughout this post, there is an input variable and an output variable for a hypothetical process. We want to compare the relationship between these two variables under two different conditions. Here is the [Minitab project file](https://cdn.app.compendium.com/uploads/user/458939f4-fe08-4dbc-b271-efca0f5a2682/742d7708-efd3-492c-abff-6044d78e3bbd/File/569a0e7d067944f6f9147434794efcd6/comparingregressionmodels.MPJ) with the data.
## Comparing Constants in Regression Analysis
When the [constants](https://blog.minitab.com/blog/adventures-in-statistics/regression-analysis-how-to-interpret-the-constant-y-intercept?hsLang=en) (or y intercepts) in two different regression equations are different, this indicates that the two regression lines are shifted up or down on the Y axis. In the scatterplot below, you can see that the Output from Condition B is consistently higher than Condition A for any given Input value. We want to determine whether this vertical shift is statistically significant.
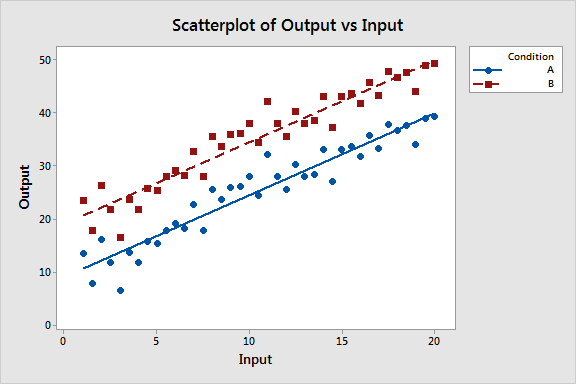
To test the difference between the constants, we just need to include a [categorical variable](https://support.minitab.com/minitab/19/help-and-how-to/statistics/tables/supporting-topics/basics/categorical-and-quantitative-variables/) that identifies the qualitative attribute of interest in the model. For our example, I have created a variable for the condition (A or B) associated with each observation.
To fit the model in Minitab, I’ll use: **Stat > Regression > Regression > Fit Regression Model**. I’ll include *Output* as the [response variable](https://support.minitab.com/minitab/19/help-and-how-to/modeling-statistics/regression/supporting-topics/basics/what-are-response-and-predictor-variables/), *Input* as the continuous predictor, and *Condition* as the categorical predictor.
In the regression analysis output, we’ll first check the coefficients table.
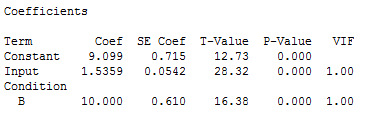
This table shows us that the relationship between Input and Output is statistically significant because the p-value for Input is 0.000.
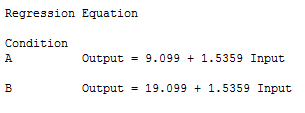
The [coefficient](https://blog.minitab.com/blog/adventures-in-statistics/how-to-interpret-regression-analysis-results-p-values-and-coefficients?hsLang=en) for Condition is 10 and its [p-value](https://blog.minitab.com/blog/adventures-in-statistics/how-to-interpret-regression-analysis-results-p-values-and-coefficients?hsLang=en) is significant (0.000). The coefficient tells us that the vertical distance between the two regression lines in the scatterplot is 10 units of Output. The p-value tells us that this difference is statistically significant—you can reject the null hypothesis that the distance between the two constants is zero. You can also see the difference between the two constants in the regression equation table below.
## Comparing Coefficients in Regression Analysis
When two slope coefficients are different, a one-unit change in a predictor is associated with different mean changes in the response. In the scatterplot below, it appears that a one-unit increase in Input is associated with a greater increase in Output in Condition B than in Condition A. We can *see* that the slopes look different, but we want to be sure this difference is statistically significant.
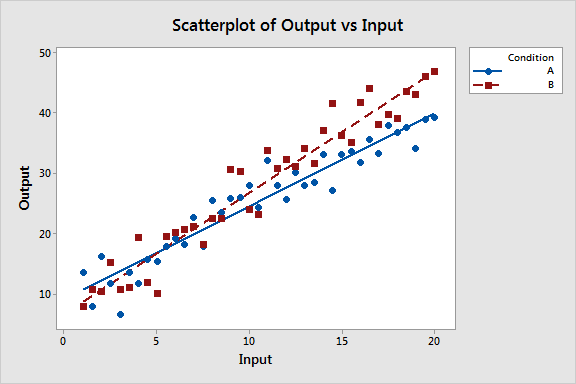
How do you statistically test the difference between regression coefficients? It sounds like it might be complicated, but it is actually very simple. We can even use the same Condition variable that we did for testing the constants.
We need to determine whether the coefficient for Input depends on the Condition. In statistics, when we say that the effect of one variable depends on another variable, that’s an interaction effect. All we need to do is include the interaction term for Input\*Condition!
In Minitab, you can specify interaction terms by clicking the **Model** button in the main regression dialog box. After I fit the regression model with the interaction term, we obtain the following coefficients table:
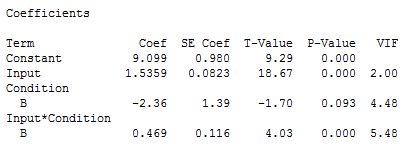
The table shows us that the interaction term (Input\*Condition) is statistically significant (p = 0.000). Consequently, we reject the null hypothesis and conclude that the difference between the two coefficients for Input (below, 1.5359 and 2.0050) does not equal zero. We also see that the main effect of Condition is not significant (p = 0.093), which indicates that difference between the two constants is not statistically significant.
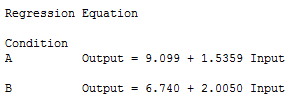
It is easy to compare and test the differences between the constants and coefficients in regression models by including a categorical variable. These tests are useful when you can see differences between regression models and you want to defend your conclusions with p-values.
If you're learning about regression, read my [regression tutorial](https://blog.minitab.com/blog/adventures-in-statistics/regression-analysis-tutorial-and-examples?hsLang=en)!
## You Might Also Like
[Understanding t-Tests: Why Degrees of Freedom Appeared in Minitab (and Why They Matter)](https://blog.minitab.com/en/blog/understanding-t-tests-why-degrees-of-freedom-appeared-in-minitab-and-why-they-matter?hsLang=en)
[Minitab Solution Center](https://blog.minitab.com/en/blog/tag/minitab-solution-center) | 5 Minute Read
[Which World Cup Quarterfinal Teams Look Most Like Past Champions?](https://blog.minitab.com/en/blog/which-world-cup-quarterfinal-teams-look-most-like-past-champions?hsLang=en)
[Minitab Solution Center](https://blog.minitab.com/en/blog/tag/minitab-solution-center) | 6 Minute Read
[New Minitab Updates Unite Data Collection, Preparation, and Predictive Analytics](https://blog.minitab.com/en/blog/new-minitab-updates-unite-data-collection-preparation-and-predictive-analytics?hsLang=en)
[Data Preparation](https://blog.minitab.com/en/blog/tag/data-preparation) | 5 Minute Read
---
- [Careers](https://www.minitab.com/en-us/company/careers/)
- [Trust Center](https://www.minitab.com/en-us/trust-center/)
- [Suppliers](https://www.minitab.com/en-us/suppliers/)
- [Site Map](https://www.minitab.com/en-us/site-map/)
- [](https://www.linkedin.com/company/minitab/)
- [](https://www.facebook.com/Minitab/)
- [](https://www.youtube.com/user/MinitabInc)
- [](https://www.instagram.com/minitab/)
---
© 2025 Minitab, LLC. All Rights Reserved.
- [Terms of Use](https://www.minitab.com/en-us/legal/terms-of-use/)
- [Privacy Policy](https://www.minitab.com/en-us/legal/privacy-policy/)
- [Legal](https://www.minitab.com/en-us/legal/)
- Cookies Settings