In my last post, I professed my fondness for regression analysis. This time, I’m going compare two automatic tools that will help you to create a regression model.
Imagine a scenario where you have many predictor variables and a response variable. Because there are so many predictor variables, you’d like some help in creating a good regression model. You could try a lot of combinations on your own. But, you’re in luck! Minitab Statistical Software has not one, but two automatic tools that will help you pick a regression model.
These tools are Stepwise Regression and Best Subsets Regression. They both identify useful predictors during the exploratory stages of model building for ordinary least squares regression. These are both great procedures, but they work a bit differently. I’ll compare and contrast them, and then I’ll use both on one dataset.
Stepwise Regression
Stepwise regression selects a model by automatically adding or removing individual predictors, a step at a time, based on their statistical significance. The end result of this process is a single regression model, which makes it nice and simple. You can control the details of the process, including the significance level and whether the process can only add terms, remove terms, or both.
Best Subsets Regression
Best Subsets compares all possible models using a specified set of predictors, and displays the best-fitting models that contain one predictor, two predictors, and so on. The end result is a number of models and their summary statistics. It is up to you to compare and choose one. Sometimes the results do not point to one best model and your judgment is required.
Comparison
Both procedures build models from a set of predictors that you specify. Stepwise does not assess all models but constructs a model by adding or removing one predictor at a time. Best Subsets does assess all possible models and it presents you with the best candidates. Stepwise yields a single model, which can be simpler. Best subsets provides more information by including more models, but it can be more complex to choose one. Because Best Subsets assesses all possible models, large models may take a long time to process.
Example Using Both Methods
All right, let’s take a single dataset, use both procedures, and see what happens. To follow along, download ThermalEnergyTest.MTW.
As part of a test of solar thermal energy, we want to examine whether total heat flux can be predicted by various variables, including the position of the focal points in the east, south, and north directions.
For both procedures, I’ll include the same response variable and predictors.
Response: Heatflux
Predictors: Insolation, East, South, North, Time
Stepwise Regression Example
I’ll start with Stepwise. You can find the stepwise procedure as an option within regression analysis: Stat > Regression > Regression > Fit Regression Model. It’s a simple matter to enter the response and predictors in the dialog box. Click the Stepwise button and choose Stepwise for the Method.

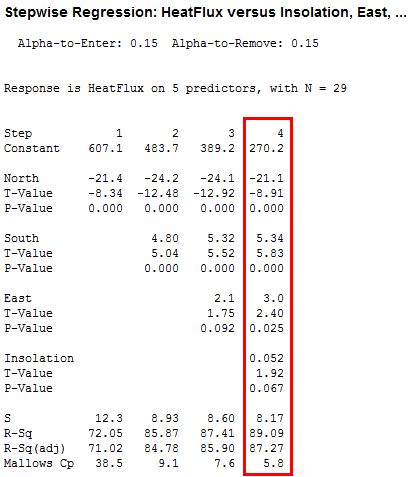
The four steps run horizontally across the output. For each step, the procedure added these predictors: North, South, East, and Insolation. At this point, no more variables could enter or leave, so the procedure stopped. I’ve highlighted the final model, which has an R2 of 89.09%. Nice and simple!
Best Subsets Regression Example
Now, let’s use the same variables with Best Subsets regression: Stat > Regression > Regression > Best Subsets. We’ll stick with the defaults and get the following output.

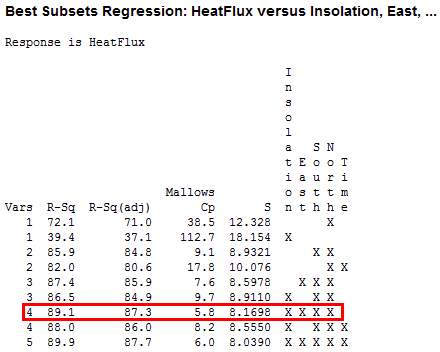
Each line of the output represents a different model. Vars indicates the number of predictors in the model. Predictors that are present in the model are indicated by an X. Minitab displays the two best models for each number of predictors. A good model should have a high R2 and adjusted R2, small S, and a Mallows' Cp close to the number of predictors in the model and the constant. Using the adjusted R2 is recommended over R2 for comparing models with different numbers of terms.
For a more detailed explanation of the model fit statistics and how to interpret them, look at the Glossary and StatGuide in Minitab’s Help menu.
I’ve highlighted the model that Stepwise picked. Based on the criteria above, it looks to be a good model. However, Best Subsets gives us more contextual information that can be helpful. We might have specific priorities that affect our choice for the best model.
For example, if we placed a higher priority on simplifying and reducing data collection costs, we’d be interested to see that some models with fewer predictors are almost as good. For example, the R2 for the three-variable model with East, South, and North is only 1.7% less than the highlighted model. Further, the best two-variable model is also not far behind.
If we placed a higher priority on prediction accuracy, we’d be interested in the 5 variable model because the model fit statistics are mostly better. In fact, the adjusted R2 for the 5 variable model is slightly better than the model that Stepwise picked.
The extra information that Best Subsets provides allows us to use our subject area knowledge to help pick a more optimal model. However, it also takes a bit more knowledge and effort.
Check Your Models with General Regression
One thing that Best Subsets can’t do is check the residual plots. Use Fit Regression Model to assess your model and obtain additional statistics, which can help you choose the model.
For example, if we were interested in the five-variable model for its better fit and perhaps better predictions, we’d see in the Fit Regression Model output that the predicted R2 falls slightly with the five-variable model. This tends to happen when the model is overly complicated and it starts to model the noise in the data. When that happens, the model fits the original data but is less capable of providing valid predictions for new observations. This condition is known as "overfitting the model" and illustrates how subset models may actually predict future responses with smaller variance than the full model.
Closing Thoughts
Automatic variable selection procedures can be a valuable tool in data analysis, particularly in the early stages of building a model. The choice between Stepwise and Best Subsets is largely between the convenience of a single model versus the additional information that Best Subsets provides. Of course, you can always just run both, like I did.
The procedures often work very well but you should be aware of the potential pitfalls:
- Automatic procedures can look at many variables and select ones which, by pure chance, happen to fit well. Look at the results critically and use your subject area knowledge to see if the results make sense.
- Automatic procedures cannot take into account special knowledge the analyst may have about the data. Therefore, the model selected may not be the best from a practical point of view.
- Stepwise may not select the model with the highest R2 value.
To learn which method chooses the correct model for often, read my post Which is Better, Stepwise Regression or Best Subsets Regression.
Have fun modeling your world! If you're learning about regression, read my regression tutorial!


