Repeated measures designs don’t fit our impression of a typical experiment in several key ways. When we think of an experiment, we often think of a design that has a clear distinction between the treatment and control groups. Each subject is in one, and only one, of these non-overlapping groups. Subjects who are in a treatment group are exposed to only one type of treatment. This is the common independent groups experimental design.
These ideas seem important, but repeated measures designs throw them out the window! What if you have a subject in the control group and all the treatment groups? Is this a problem? Not necessarily. In fact, repeated measures designs can provide tremendous benefits!
In this post, I’ll highlight the advantages and disadvantages of using a repeated measures design and show an example of how to analyze a repeated measures design using ANOVA in Minitab.
What Are Repeated Measures Designs?
As you'd expect, repeated measures designs involve multiple measurements of each subject. That’s no surprise, but there is more to it than just that. In repeated measures designs, the subjects are typically exposed to all of the treatment conditions. Surprising, right?
In this type of design, each subject functions as an experimental block. A block is a categorical variable that explains variation in the response variable that is not caused by the factors that you really want to know about. You use blocks in designed experiments to minimize bias and variance of the error because of these nuisance factors.
In repeated measures designs, the subjects are their own controls because the model assesses how a subject responds to all of the treatments. By including the subject block in the analysis, you can control for factors that cause variability between subjects. The result is that only the variability within subjects is included in the error term, which usually results in a smaller error term and a more powerful analysis.
The Benefits of Repeated Measures Designs
More statistical power: Repeated measures designs can be very powerful because they control for factors that cause variability between subjects.
Fewer subjects: Thanks to the greater statistical power, a repeated measures design can use fewer subjects to detect a desired effect size. Further sample size reductions are possible because each subject is involved with multiple treatments. For example, if an independent groups design requires 20 subjects per experimental group, a repeated measures design may only require 20 total.
Quicker and cheaper: Fewer subjects need to be recruited, trained, and compensated to complete an entire experiment.
Assess an effect over time: Repeated measures designs can track an effect overtime, such as the learning curve for a task. In this situation, it’s often better to measure the same subject at multiple times rather than different subjects at one point in time for each.
Managing the Challenges of Repeated Measures Designs
Repeated measures designs have some disadvantages compared to designs that have independent groups. The biggest drawbacks are known as order effects, and they are caused by exposing the subjects to multiple treatments. Order effects are related to the order that treatments are given but not due to the treatment itself. For example, scores can decrease over time due to fatigue, or increase due to learning. In taste tests, a dry wine may get a higher rank if it was preceded by a dryer wine and a lower rank if preceded by a sweeter wine. Order effects can interfere with the analysis’ ability to correctly estimate the effect of the treatment itself.
There are various methods you can use to reduce these problems in repeated measures designs. These methods include randomization, allowing time between treatments, and counterbalancing the order of treatments among others. Finally, it’s always good to remember that an independent groups design is an alternative for avoiding order effects.
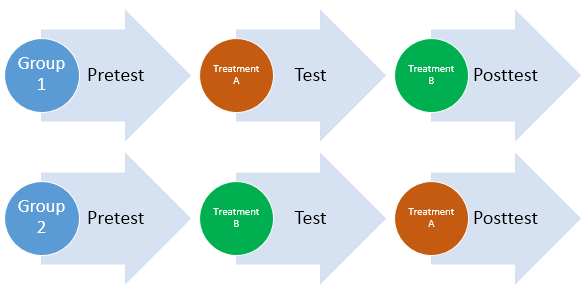
Below is a very common crossover repeated measures design. Studies that use this type of design are as diverse as assessing different advertising campaigns, training programs, and pharmaceuticals. In this design, subjects are randomly assigned to the two groups and you can add additional treatments and a control group as needed.
There are many different types of repeated measures designs and it’s beyond the scope of this post to cover all of them. Each study must carefully consider which design meets the specific needs of the study.
For more information about different types of repeated measures designs, how to arrange the worksheet, and how to perform the analysis in Minitab, see Analyzing a repeated measures design. Also, learn how to use Minitab to analyze a Latin square with repeated measures design. Now, let’s use Minitab to perform a complex repeated measures ANOVA!
Example of Repeated Measures ANOVA
An experiment was conducted to determine how several factors affect subject accuracy in adjusting dials. Three subjects perform tests conducted at one of two noise levels. At each of three time periods, the subjects monitored three different dials and make adjustments as needed. The response is an accuracy score. The noise, time, and dial factors are crossed, fixed factors. Subject is a random factor, nested within noise. Noise is a between-subjects factor, time and dial are within-subjects factors.
Here are the data to try this yourself. If you're not already using our software and you want to play along, you can get a free 30-day trial version.
To analyze this repeated measures design using ANOVA in Minitab, choose: Stat > ANOVA > General Linear Model > Fit General Linear Model, and follow these steps:
- In Responses, enter Score.
- In Factors, enter Noise Subject ETime Dial.
- Click Random/Nest.
- Under Nesting, enter Noise in the cell to the right of Subject.
- Under Factor type, choose Random in the cell to the right of Subject.
- Click OK, and then click Model.
- Under Factors and Covariates, select all of the factors.
- From the pull-down to the right of Interactions through order, choose 3.
- Click the Add button.
- From Terms in model, choose Subject*Etime*Dial(Noise) and click Delete.
- Click OK in all dialog boxes.
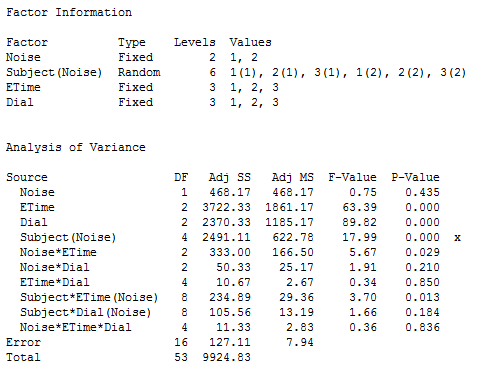
Below are the highlights.
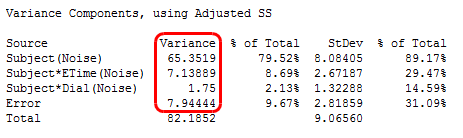
You can gain some idea about how the design affected the sensitivity of the F-tests by viewing the variance components below. The variance components used in testing within-subjects factors are smaller (7.13889, 1.75, 7.94444) than the between-subjects variance (65.3519). It is typical that a repeated measures model can detect smaller differences in means within subjects as compared to between subjects.
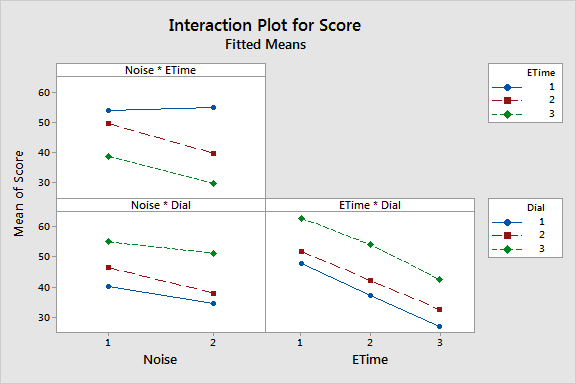
Of the four interactions among fixed factors, the noise by time interaction was the only one with a low p-value (0.029). This implies that there is significant evidence for judging that a subjects' sensitivity to noise changed over time. There is also significant evidence for a dial effect (p-value < 0.0005). Among random terms, there is significant evidence for time by subject (p-value = 0.013) and subject (p-value < 0.0005) effects.
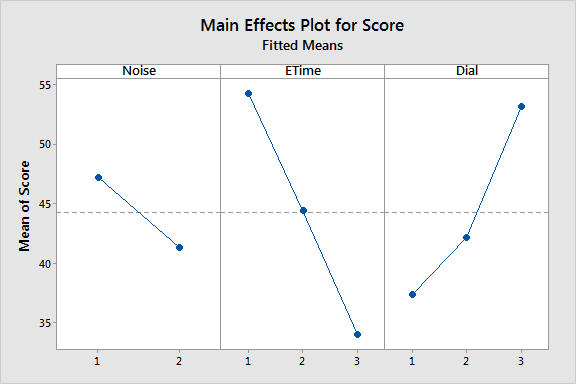
In closing, I'll graph these effects using Stat > ANOVA > General Linear Model > Factorial Plots. This handy tool takes our ANOVA model and produces a main effects plot and an interactions plot to help us understand what the results really mean.