P values have been around for nearly a century and they’ve been the subject of criticism since their origins. In recent years, the debate over P values has risen to a fever pitch. In particular, there are serious fears that P values are misused to such an extent that it has actually damaged science.
In March 2016, spurred on by the growing concerns, the American Statistical Association (ASA) did something that it has never done before and took an official position on a statistical practice—how to use P values. The ASA tapped a group of 20 experts who discussed this over the course of many months. Despite facing complex issues and many heated disagreements, this group managed to reach a consensus on specific points and produce the ASA Statement on Statistical Significance and P-values.
I’ve written previously about my concerns over how P values have been misused and misinterpreted. My opinion is that P values are powerful tools but they need to be used and interpreted correctly. P value calculations incorporate the effect size, sample size, and variability of the data into a single number that objectively tells you how consistent your data are with the null hypothesis. You can read my case for the power of P values in my rebuttal to a journal that banned them.
The ASA statement contains the following six principles on how to use P values, which are remarkably aligned with my own. Let’s take a look at what they came up with.
- P-values can indicate how incompatible the data are with a specified statistical model.
- P-values do not measure the probability that the studied hypothesis is true, or the probability that the data were produced by random chance alone.
I discuss these ideas in my post How to Correctly Interpret P Values. It turns out that the common misconception stated in principle #2 creates the illusion of substantially more evidence against the null hypothesis than is justified. There are a number of reasons why this type of P value misunderstanding is so common. In reality, a P value is a probability about your sample data and not about the truth of a hypothesis.
- Scientific conclusions and business or policy decisions should not be based only on whether a p-value passes a specific threshold.
In statistics, we’re working with samples to describe a complex reality. Attempting to discover the truth based on an oversimplified process of comparing a single P value to an arbitrary significance level is destined to have problems. False positives, false negatives, and otherwise fluky results are bound to happen.
Using P values in conjunction with a significance level to decide when to reject the null hypothesis increases your chance of making the correct decision. However, there is no magical threshold that distinguishes between the studies that have a true effect and those that don’t with 100% accuracy. You can see a graphical representation of why this is the case in my post Why We Need to Use Hypothesis Tests.
When Sir Ronald Fisher introduced P values, he never intended for them to be the deciding factor in such a rigid process. Instead, Fisher considered them to be just one part of a process that incorporates scientific reasoning, experimentation, statistical analysis and replication to lead to scientific conclusions.
According to Fisher, “A scientific fact should be regarded as experimentally established only if a properly designed experiment rarely fails to give this level of significance.”
In other words, don’t expect a single study to provide a definitive answer. No single P value can divine the truth about reality by itself.
- Proper inference requires full reporting and transparency.
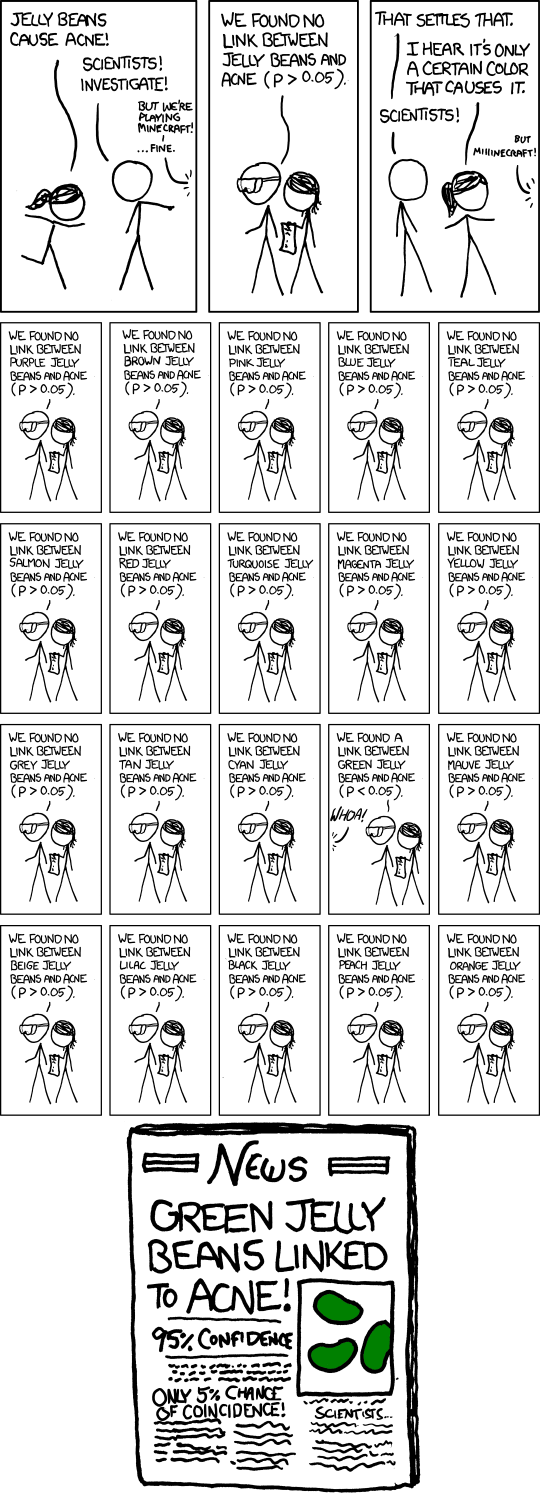
If you don’t know the full context of a study, you can’t properly interpret a carefully selected subset of the results. Data dredging, cherry picking, significance chasing, data manipulation, and other forms of p-hacking can make it impossible to draw the proper conclusions from selectively reported findings. You must know the full details about all data collection choices, how many and which analyses were performed, and all P values.

- A p-value, or statistical significance, does not measure the size of an effect or the importance of an effect.
- By itself, a p-value does not provide a good measure of evidence regarding a model or hypothesis.
I cover these ideas, and more, in my Five Guidelines for Using P Values. P-values don’t tell you the size or importance of the effect. An effect can be statistically significant but trivial in the real world. This is the difference between statistical significance and practical significance. The analyst should supplement P values with other statistics, such as effect sizes and confidence intervals, to convey the importance of the effect.
Researchers need to apply their scientific judgment about the plausibility of the hypotheses, results of similar studies, proposed mechanisms, proper experimental design, and so on. Expert knowledge transforms statistics from numbers into meaningful, trustworthy findings.


