Anyone who has performed ordinary least squares (OLS) regression analysis knows that you need to check the residual plots in order to validate your model. Have you ever wondered why? There are mathematical reasons, of course, but I’m going to focus on the conceptual reasons. The bottom line is that randomness and unpredictability are crucial components of any regression model. If you don’t have those, your model is not valid.
Why? To start, let’s breakdown and define the 2 basic components of a valid regression model:
Response = (Constant + Predictors) + Error
Another way we can say this is:
Response = Deterministic + Stochastic
The Deterministic Portion
This is the part that is explained by the predictor variables in the model. The expected value of the response is a function of a set of predictor variables. All of the explanatory/predictive information of the model should be in this portion.
The Stochastic Error
Stochastic is a fancy word that means random and unpredictable. Error is the difference between the expected value and the observed value. Putting this together, the differences between the expected and observed values must be unpredictable. In other words, none of the explanatory/predictive information should be in the error.
The idea is that the deterministic portion of your model is so good at explaining (or predicting) the response that only the inherent randomness of any real-world phenomenon remains leftover for the error portion. If you observe explanatory or predictive power in the error, you know that your predictors are missing some of the predictive information. Residual plots help you check this!
Statistical caveat: Regression residuals are actually estimates of the true error, just like the regression coefficients are estimates of the true population coefficients.
Using Residual Plots
Using residual plots, you can assess whether the observed error (residuals) is consistent with stochastic error. This process is easy to understand with a die-rolling analogy. When you roll a die, you shouldn’t be able to predict which number will show on any given toss. However, you can assess a series of tosses to determine whether the displayed numbers follow a random pattern. If the number six shows up more frequently than randomness dictates, you know something is wrong with your understanding (mental model) of how the die actually behaves. If a gambler looked at the analysis of die rolls, he could adjust his mental model, and playing style, to factor in the higher frequency of sixes. His new mental model better reflects the outcome.
The same principle applies to regression models. You shouldn’t be able to predict the error for any given observation. And, for a series of observations, you can determine whether the residuals are consistent with random error. Just like with the die, if the residuals suggest that your model is systematically incorrect, you have an opportunity to improve the model.
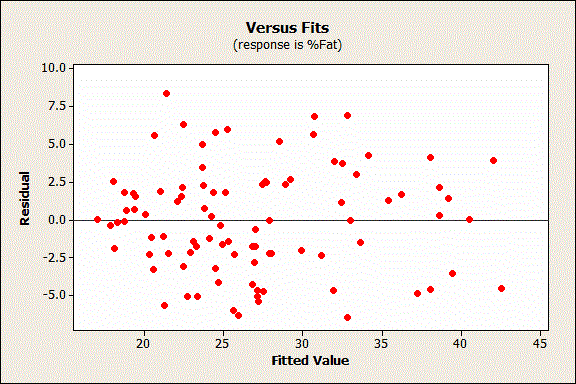
So, what does random error look like for OLS regression? The residuals should not be either systematically high or low. So, the residuals should be centered on zero throughout the range of fitted values. In other words, the model is correct on average for all fitted values. Further, in the OLS context, random errors are assumed to produce residuals that are normally distributed. Therefore, the residuals should fall in a symmetrical pattern and have a constant spread throughout the range. Here's how residuals should look:

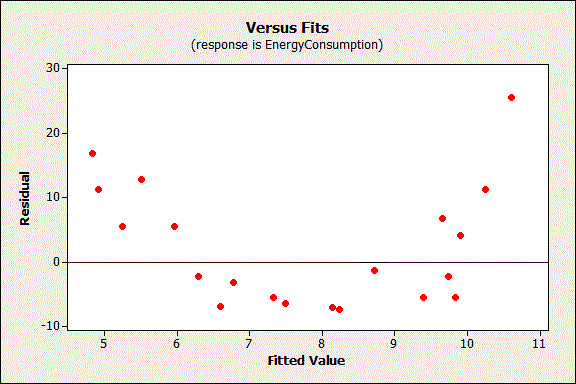
Now let’s look at a problematic residual plot. Keep in mind that the residuals should not contain any predictive information.

In the graph above, you can predict non-zero values for the residuals based on the fitted value. For example, a fitted value of 8 has an expected residual that is negative. Conversely, a fitted value of 5 or 11 has an expected residual that is positive.
The non-random pattern in the residuals indicates that the deterministic portion (predictor variables) of the model is not capturing some explanatory information that is “leaking” into the residuals. The graph could represent several ways in which the model is not explaining all that is possible. Possibilities include:
- A missing variable
- A missing higher-order term of a variable in the model to explain the curvature
- A missing interaction between terms already in the model
Identifying and fixing the problem so that the predictors now explain the information that they missed before should produce a good-looking set of residuals!
In addition to the above, here are two more specific ways that predictive information can sneak into the residuals:
- The residuals should not be correlated with another variable. If you can predict the residuals with another variable, that variable should be included in the model. In Minitab’s regression, you can plot the residuals by other variables to look for this problem.
- Adjacent residuals should not be correlated with each other (autocorrelation). If you can use one residual to predict the next residual, there is some predictive information present that is not captured by the predictors. Typically, this situation involves time-ordered observations. For example, if a residual is more likely to be followed by another residual that has the same sign, adjacent residuals are positively correlated. You can include a variable that captures the relevant time-related information, or use a time series analysis. In Minitab’s regression, you can perform the Durbin-Watson test to test for autocorrelation.
Are You Seeing Non-Random Patterns in Your Residuals?
I hope this gives you a different perspective and a more complete rationale for something that you are already doing, and that it’s clear why you need randomness in your residuals. You must explain everything that is possible with your predictors so that only random error is leftover. If you see non-random patterns in your residuals, it means that your predictors are missing something.
If you're learning about regression, read my regression tutorial!


