


Genichi Taguchi is famous for his pioneering methods of robust quality engineering. One of the major contributions that he made to quality improvement methods is Taguchi designs.
Designed experiments were first used by agronomists during the last century. This method seemed highly theoretical at first, and was initially restricted to agronomy. Taguchi made the designed experiment approach more accessible to practitioners in the manufacturing industry.
Thanks partly to him, Design of Experiments (DOE) has become quite popular in many companies, and these methods are widely taught in universities and engineering school. In this blog post, I would like to describe differences between Taguchi DOEs and standard Factorial DOEs.
Taguchi Designs
Both Taguchi designs and Factorial designs are are available in the DOE menu in Minitab Statistical Software. To select a design go to Stat > DOE.
Many Taguchi designs are based on Factorial designs (2-level designs and Plackett & Burman designs, as well as factorial designs with more than 2 levels). Taguchi’s L8 design, for example, is actually a standard 23 (8-run) factorial design.
Taguchi's designs are usually highly fractionated, which makes them very attractive to practitioners. Doing a half-fraction, quarter-fraction or eighth-fraction of a full factorial design greatly reduces costs and time needed for a designed experiment.
The drawback of a fractionated design is that some interactions may be confounded with other effects. It is important to consider carefully the role of potential confounders and aliases. Failure to take account of such confounded effects can result in erroneous conclusions and misunderstandings.
When using a Taguchi design, one needs to guess which interactions are most likely to be significant—even before any experiment is performed. Taguchi created several linear graphs to help practitioners select the interactions they want to study, based on their prior process knowledge.
Example from a two-level, eight-factor L16 Taguchi design:
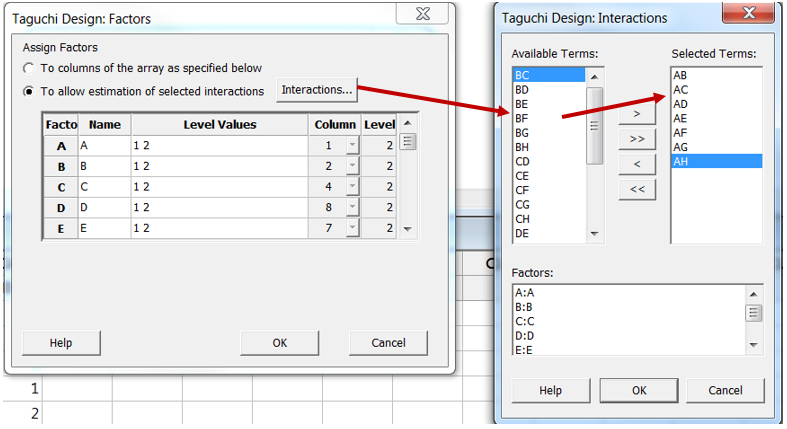
Linear graphs are not displayed in Minitab, but factor allocation and interaction selection are based on Taguchi linear graphs. Suppose that factor A is allocated to column 1 of the orthogonal array, factor B to column 2, C to column 4, D to column 8, E to column 7, F to column 11, G to column 13, and H to column 14 (as described in the Minitab dialog box above and this matches with the corresponding Taguchi linear graph below). With this design, one may select the AB, AC, AD, AE, AF, AG, AH interactions. It is not possible to analyze the remaining interactions, since they are confounded with the selected interactions.

Taguchi suggested several other linear graphs for an L16 design (a 16-run factorial design):

Standard Fractional Factorial Designs
In a standard factorial (non-Taguchi) design, identifying the interactions most likely to be significant is based on alias / confounding "chains." The same alias chains apply to Taguchi designs, but are not displayed. Practitioners may not necessarily be aware that some interaction effects are confounded. However, when you use the factorial design functionality in Minitab the alias chains are clearly displayed showing the confounding pattern:
AB + CG + DH + EF
AC + BG + DF + EH
AD + BH + CF + EG
AE + BF + CH + DG
AF + BE + CD + GH
AG + BC + DE + FH
AH + BD + CE + FG
Confounding patterns are a lot more complex for 3-level and 4-level designs.
In the factorial design menu, the diagram below displays the designs that are available and their resolution (level of confounding). In Minitab, you can quickly access the table of factorial designs shown below by selecting Stat > DOE > Factorial > Create Factorial Design... and clicking "Display Available Designs."
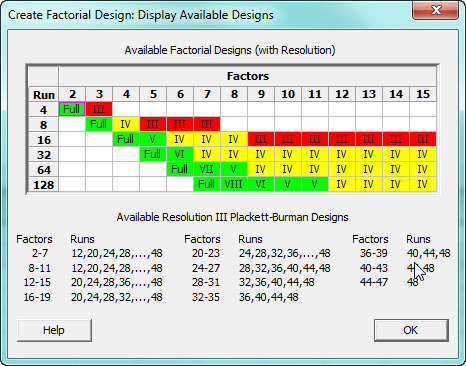
Red (Resolution III) designs should be avoided (because main effects are confounded with two-factor interactions). In experiments that use Yellow (Resolution IV) designs, two-factor interactions are confounded with other two-factor interactions. These popular designs provide a good compromise between the amount of information obtained and costs (number of experimental runs). The higher resolution designs (in green) offer high quality—with limited or no confounding—at higher costs.
The Pareto and “Heredity” Principles
In a Resolution IV (yellow region) design, main effects are not confounded with two-factor interactions. Often, after an experiment has been performed, the experimenter discovers that only a few of the many effects investigated turn out to be important (the “Pareto rule”).
When two interactions are confounded with one another, the interaction that is the most likely to be significant is the one containing factors whose main effects are themselves significant (based on the so called “heredity” or “hierarchy” principle). These principles are extremely useful to identify the interactions most likely to be important. We can expect only a few effects to be statistically significant, and we can focus on the interactions containing factors whose main effects are themselves significant.
Two Approaches to Selecting Which Interactions Are Important
Taguchi designs are based on prior selection of the most likely interactions, whereas in standard fractional factorial designs, the interactions are selected later on, after the initial results from the designed experiments have been analyzed. The way in which interactions are selected clearly differs between the two approaches.
According to Taguchi, optimizing a process is not sufficient: making processes and products more robust to quality issues and environmental noises is crucial. In this strategy, designed experiments clearly play a central role.