


There are many reasons why a distribution might not be normal/Gaussian. A non-normal pattern might be caused by several distributions being mixed together, or by a drift in time, or by one or several outliers, or by an asymmetrical behavior, some out-of-control points, etc.
I recently collected the scores of three different teams (the Blue team, the Yellow team and the Pink team) after a laser tag game session one Saturday afternoon. The three teams represented three different groups of friends wishing to spend their afternoon tagging players from competing teams. Gengiz Khan turned out to be the best player, followed by Tarantula and Desert Fox.
One-Way ANOVA
In this post, I will focus on team performances, not on single individuals. I decided to compare the average scores of each team. The best tool I could possibly think of was a one-way ANOVA using the Minitab Assistant (with a continuous Y response and three sample means to compare).
To assess statistical significance, the differences between team averages are compared to the within (team) variability. A large between-team variability compared to a small within-team variability (the error term) means that the differences between teams are statistically significant.
In this comparison (see the output from the Assistant below), the P value was 0.053, just above the 0.05 standard usual threshold. The P value is the probability that the differences in observed means are only due to random causes. A p-value above 0.05, therefore, indicates that the probability that such differences are only due to random causes is not negligible. Because of that, the differences are not considered to be statistically significant (there is "not enough evidence that there are significant differences," according to the comments in Minitab Assistant). But the result remains somewhat ambiguous since the p-value is still very close to the significance limit (0.05).
Note that the variability within the Blue team seems to be much larger (see the confidence interval plot in the means comparison chart below) than for the other two groups. This not a cause for concern in this case, since the Minitab Assistant uses the Welch method of ANOVA, which does not require or assume variances within groups to be equal.

Outliers and Normality
When looking at the distribution of individual data (below) one point seems to be an outlier or at least a suspect, extreme value (marked in red). This is Gengiz Khan, the best player. In my worksheet, the scores have been entered from the best to the worst (not in time order). This is why we can see a downward trend in the chart on the right site of the diagnostic report (see below).

The Report Card (see below) from the Minitab Assistant shows that Normality might be an issue (the yellow triangle is a warning sign) because the sample sizes are quite small. We need to check normality within each team. The second warning sign is due to the unusual / extreme data (score in row 1) which may bias our analysis.

Following the suggestion from the warning signal in the Minitab Assistant Report Card, I decided to run a normality test. I performed a separate normality test for each team in order not to mix different distributions together.
A low P value in the normal probability plot (see below) signals a significant departure from normality. This p-value is below 0.05 for the Blue team. The points located along the normal probability plot line represent “normal,” common, random variations. The points at the upper or lower extreme, which are distant from the line, represent unusual values or outliers. The non-normal behavior in the probability plot of the blue team is clearly due to the outlier on the right side of the normal probability plot line.

Should we remove this value (Gengiz Khan’s score) in the Blue group and rerun the analysis without him ?
Even though Gengiz Khan is more experienced and talented than the other team members, there are no particular reasons why he should be removed—he is certainly part of the Blue team. There are probably many other talented laser game players around. If another additional laser game session takes place in the future, there will probably still be a large difference between Gengiz Khan and the rest of his team.
The problem is that this extreme value tends to inflate the within-group variability. Because there is a much larger within-team variability for the blue team, differences between groups when they are compared to the residual / within variability do not appear to be significant, causing the p-value to move just above the significance threshold.
A Non-parametric Solution
One possible solution is to use a non-parametric approach. Non-parametric techniques are based on ranks, or medians. Ranks represent the relative position of an individual in comparison to others, but are not affected by extreme values (whereas a mean is sensitive to outlier values). Ranks and medians are more “robust” to outliers.
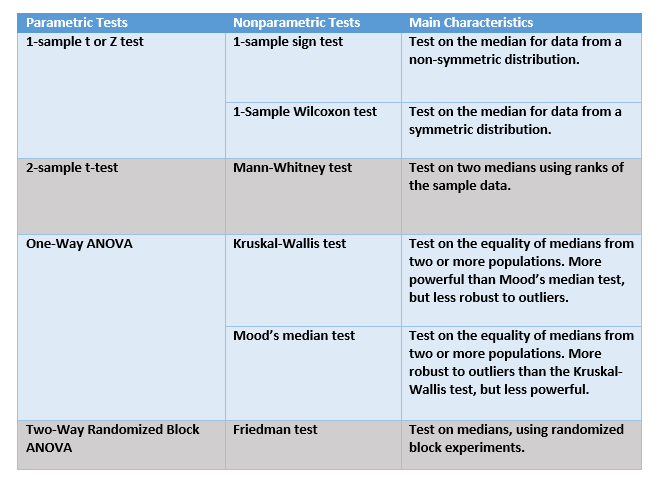
I used the Kruskal-Wallis test (see the correspondence table between parametric and non-parametric tests below). The p-value (see the output below) is now significant (less than 0.05), and the conclusion is completely different. We can consider that the differences are significant .
Kruskal-Wallis Test: Score versus Team
Kruskal-Wallis Test on Score
Team N Median Ave Rank Z
Blue 9 2550,0 23,7 2,72
Pink 13 -450,0 11,6 -2,44
Yellow 10 975,0 16,4 -0,06
Overall 32 16,5
H = 8,86 DF = 2 P = 0,012
H = 8,87 DF = 2 P = 0,012 (adjusted for ties)

See below the correspondence table for parametric and non-parametric tests :
Conclusion
Outliers do happen and removing them is not always straightforward. One nice thing about non-parametric tests is that they are more robust to such outliers. However, this does not mean that non-parametric tests should be used in any circumstance. When there are no outliers and the distribution is normal, standard parametric tests (T tests or ANOVA) are more powerful.