Machine monitoring and production monitoring are related, but they serve different functions and answer different questions, helping you know where to look and how to respond when production line issues occur.
Because they target different performance levels, they also guide different decisions when something goes wrong. Machine monitoring helps pinpoint an equipment-related problem. Production monitoring investigates a production problem; if there is a gap, it can indicate whether it is due to a machine issue, slow changeovers, a bottleneck, or another specific factor. With that clarity, teams can route problems to the right people, select the most relevant metrics, and avoid treating one machine’s performance as the full picture of production.
Production monitoring vs. machine monitoring comparison chart
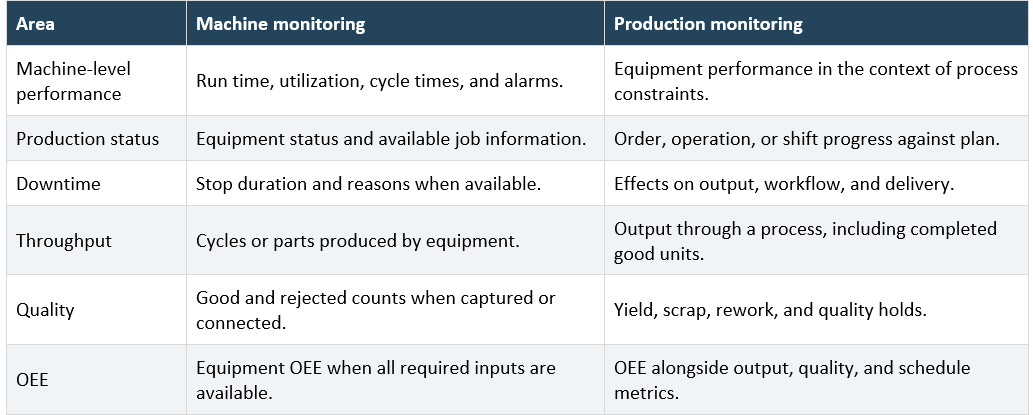
Different questions and different data
The chart summarizes the contrasts, but the distinction becomes clearer when you know the questions each system is built to answer.
- Machine monitoring software focuses on equipment performance, both in the moment and over time. It continuously gathers machine data, and operators can add operational context, such as waiting on material or preparing new tools, to clarify what the data indicates.
Example: If the floor is losing time between jobs, machine monitoring can capture downtime while an operator waits for a mold change. That visibility helps a manager ensure the tool is ready before the next job begins.
- Production monitoring software focuses on delivering quality output and meeting schedule requirements. It provides context by integrating equipment performance with schedules, operator entries, inspections, material scans, and other variables. Common data sources can include enterprise resource planning (ERP) and manufacturing execution systems (MES).
Example: Returning to the earlier situation, even after the mold is updated, production could remain behind plan. Production monitoring might show parts waiting for inspection; in that case, increasing machining speed would only increase work-in-process and compound the delay.
Both types of software can cover an entire facility, but they emphasize different things: equipment performance versus production flow and results.
See Machine Monitoring: What It Is, How It Works, and What It Reveals for an introduction to equipment data collection.
Who needs each view and when
If equipment performance is declining and the cause isn't yet clear, machine monitoring is the right starting point. With accurate and real-time machine data, operators can respond to downtime as it happens and take steps to reduce it. Common signals include unreliable downtime logs, unnoticed stops, or uncertainty about available capacity. Consistent downtime tracking also helps distinguish true breakdowns from material shortages or changeovers, since each requires a different response. Read What Downtime Actually Costs You for the business implications.
Production monitoring becomes critical when machine status alone doesn't explain missed targets, especially when you must evaluate performance across multiple operations, manual assembly steps, or shared resources. For example, a beverage line filler may run as expected while full-case output still misses plan. In that case, quality data, downtime observations, and station-level output may point to case-packer interruptions or a quality hold.
This broader view helps to make informed decisions about staffing adjustments, order prioritization, workload balancing, and other operational variables. It also helps plant leaders prioritize improvements that affect delivery and good output, and supervisors often rely on both production and equipment views within the same shift.
Get more out of monitoring
Minitab DataXchange offers configurable real-time manufacturing dashboards that monitor machines and display key performance indicators. It combines machine data collection with operator input for downtime reasons, work orders, operations, and part counts. These dashboards provide visibility into equipment status, utilization, downtime, and overall equipment effectiveness (OEE).
OEE measures performance using three components: availability, performance, and quality.
- Availability: Compares running time with planned production time. Example: OEE indicates a machine lost 40 minutes to downtime, and downtime records show most of that loss was due to tooling delays.
- Performance: Assesses output during run time against the ideal rate. Example: The machine ran the shift, but cycle times were slower than the standard, reducing output. Example: The machine ran the shift, but cycle times were slower than the standard, reducing output.
- Quality: Measures the share of parts that meet requirements without rework. Example: The equipment met its run rate, but a high scrap count reduced the number of good parts produced.
DataXchange calculates OEE automatically, helping teams determine whether throughput losses are driven primarily by downtime, slower cycles, or quality issues. Reliable OEE depends on accurate, consistent machine data so that the metric reflects true equipment effectiveness. Learn more in Reliable OEE with Real-Time Shop Floor Data.
If equipment performance is declining and the cause isn't yet clear, machine monitoring is the right starting point. With accurate and real-time machine data, operators can respond to downtime as it happens and take steps to reduce it. Common signals include unreliable downtime logs, unnoticed stops, or uncertainty about available capacity. Consistent downtime tracking also helps distinguish true breakdowns from material shortages or changeovers, since each requires a different response. Read What Downtime Actually Costs You for the business implications.
Evaluate software around your decisions
Identify the gap you need to understand: do you need a better view of machine performance or production performance? An OEE solution can help by breaking those results down into availability, performance, and quality. A holistic view of your systems can help you focus on what’s limiting output and decide what to address first.
Choose the visibility that addresses your current gap, then expand as needed. Explore Factory Floor Performance for Minitab’s broader manufacturing capabilities.