---
title: Creating a Waterfall Chart in Minitab
description: Creating a Waterfall Chart in Minitab
image: https://blog.minitab.com/hubfs/B2BML%20-%20NEW%20FILE%20MANAGER%20STRUCTURE/Blog%20Images/Imported_Blog_Media/waterfall-2-Jul-06-2025-12-35-15-4236-AM.jpg
---
English
- [English](https://blog.minitab.com/en/?hsLang=en)
- [Français](https://blog.minitab.com/fr/?hsLang=en)
- [Deutsch](https://blog.minitab.com/de/?hsLang=en)
- [Português](https://blog.minitab.com/pt/?hsLang=en)
- [Español](https://blog.minitab.com/es/?hsLang=en)
- [日本語](https://blog.minitab.com/ja/?hsLang=en)
- [한국어](https://blog.minitab.com/ko/?hsLang=en)
- [中文(简体)](https://blog.minitab.com/zh/?hsLang=en)
- [ Partners](https://www.minitab.com/en-us/company/partners/)
- [ Contact](https://www.minitab.com/en-us/company/contact-us/)
- [ Talk to Minitab](https://www.minitab.com/en-us/talk-to-minitab/)
- [ My Account](https://licensing.minitab.com/account/manage)
[](https://www.minitab.com/en-us/)
- Products
Back
[Products](https://www.minitab.com/en-us/products/)
[All Products](https://www.minitab.com/en-us/products/)
- [Minitab Solution Center](https://www.minitab.com/en-us/products/minitab-solution-center/)
- [Minitab Statistical Software](https://www.minitab.com/en-us/products/minitab/)
- [Minitab Connect](https://www.minitab.com/en-us/products/connect/)
- [Minitab Model Ops](https://www.minitab.com/en-us/products/model-ops/)
- [Minitab Education Hub](https://www.minitab.com/en-us/products/education-hub/)
- [Minitab Engage](https://www.minitab.com/en-us/products/engage/)
- [Minitab Workspace](https://www.minitab.com/en-us/products/workspace/)
- [Real-Time SPC](https://www.minitab.com/en-us/products/real-time-spc/)
- [Prolink Data Collection & SPC](https://www.minitab.com/en-us/products/prolink)
- [Simul8 Discrete Event Simulation](https://info.minitab.com/en/new-to-simul8?hsLang=en)
- [SPM](https://www.minitab.com/en-us/products/spm/)
- Solutions
Back
[Solutions](https://www.minitab.com/en-us/solutions/)
[All Solutions](https://www.minitab.com/en-us/solutions/)
- [Analytics](https://www.minitab.com/en-us/solutions/analytics/)
- [Statistics & Predictive Analytics](https://www.minitab.com/en-us/solutions/analytics/statistical-analysis-predictive-analytics/)
- [Data Science & Machine Learning](https://www.minitab.com/en-us/solutions/analytics/data-science-machine-learning/)
- [Business Analytics & Intelligence](https://www.minitab.com/en-us/solutions/analytics/business-analytics-intelligence/)
- [Statistical Process Control](https://www.minitab.com/en-us/solutions/analytics/statistical-process-control/)
- [Quality Analytics](https://www.minitab.com/en-us/solutions/analytics/quality-analytics/)
- [Live Analytics](https://www.minitab.com/en-us/solutions/analytics/live-analytics/)
- [Reliability & Life Data Analysis](https://www.minitab.com/en-us/solutions/analytics/reliability/)
- [Discrete Event Simulation](https://info.minitab.com/en/new-to-simul8?hsLang=en)
- [Process Mining](https://info.minitab.com/en/new-to-simul8?hsLang=en)
- [Key Capabilities](https://www.minitab.com/en-us/solutions/key-capabilities/)
- [Continuous Improvement](https://www.minitab.com/en-us/solutions/key-capabilities/continuous-improvement/)
- [Data Integration & Data Prep](https://www.minitab.com/en-us/solutions/key-capabilities/data-integration-data-prep/)
- [Diagramming & Mind Mapping](https://www.minitab.com/en-us/solutions/key-capabilities/diagramming-mind-mapping/)
- [Digital Twins](https://info.minitab.com/en/new-to-simul8?hsLang=en)
- [Model Deployment & ML Ops](https://www.minitab.com/en-us/solutions/key-capabilities/model-deployment-ml-ops/)
- [Innovation & Project Management](https://www.minitab.com/en-us/solutions/key-capabilities/innovation-project-management/)
- [Process Excellence: Detect, Correct & Prevent](https://www.minitab.com/en-us/solutions/key-capabilities/process-excellence/)
- [Featured Industries](https://www.minitab.com/en-us/solutions/industry/)
- [Academic](https://www.minitab.com/en-us/solutions/industry/academic/)
- [Energy & Natural Resources](https://www.minitab.com/en-us/solutions/industry/energy-resources/)
- [Government & Public Sector](https://www.minitab.com/en-us/solutions/industry/government/)
- [Healthcare](https://www.minitab.com/en-us/solutions/industry/healthcare/)
- [Insurance](https://www.minitab.com/en-us/solutions/industry/insurance/)
- [Manufacturing & Industrial](https://www.minitab.com/en-us/solutions/industry/manufacturing-industrial/)
- [Services](https://www.minitab.com/en-us/solutions/industry/service-industries/)
- [Software & Technology](https://www.minitab.com/en-us/solutions/industry/software-technology/)
- [Construction](https://www.minitab.com/en-us/solutions/industry/construction/)
- [Featured Roles](https://www.minitab.com/en-us/solutions/role/)
- [Engineering](https://www.minitab.com/en-us/solutions/role/engineering/)
- [Business Analysis](https://www.minitab.com/en-us/solutions/role/business-analysts/)
- [Information Technology](https://www.minitab.com/en-us/solutions/role/information-technology/)
- [Supply Chain](https://www.minitab.com/en-us/solutions/role/supply-chain/)
- [Customer Service & Contact Center](https://www.minitab.com/en-us/solutions/role/customer-service-contact-center/)
- [Human Resources](https://www.minitab.com/en-us/solutions/role/human-resources/)
- [Marketing](https://www.minitab.com/en-us/solutions/role/marketing/)
- [Research and Development](https://www.minitab.com/en-us/solutions/role/research-and-development/)
- Resources & Services
Back
[Resources & Services](https://www.minitab.com/en-us/resources-services/)
[All Resources & Services](https://www.minitab.com/en-us/resources-services/)
- [Resources](https://www.minitab.com/en-us/resources-services/resources/)
- [Case Studies](https://www.minitab.com/en-us/resources-services/resources/case-studies/)
- [eBooks & White Papers](https://www.minitab.com/en-us/resources-services/resources/ebooks-and-white-papers/)
- [Blog](https://blog.minitab.com/blog/?hsLang=en)
- [Data Sets](https://www.minitab.com/en-us/resources-services/resources/data-set/)
- [Webinars & Events](https://www.minitab.com/en-us/resources-services/resources/events/)
- [Education Hub](https://www.minitab.com/en-us/resources-services/resources/education-hub/)
- [Services](https://www.minitab.com/en-us/resources-services/services/)
- [Training](https://www.minitab.com/en-us/resources-services/services/training/)
- [Deployment](https://www.minitab.com/en-us/resources-services/services/deployment/)
- [Consulting](https://www.minitab.com/en-us/resources-services/services/statistical-consulting/)
- [Self-Paced Learning](https://www.minitab.com/en-us/resources-services/services/self-paced-learning/)
- [Continuing Education](https://www.minitab.com/en-us/resources-services/services/continuing-education/)
- Support
Back
[Support](https://www.minitab.com/en-us/support/)
[Technical Support](https://www.minitab.com/en-us/support/)
- [Subscriptions & Activation](https://www.minitab.com/en-us/support/subscriptions-and-activation/)
- [Minitab Quick Start](https://www.minitab.com/en-us/support/quick-start/)
- [Training](https://www.minitab.com/en-us/resources-services/services/training/)
- [Installation Support](https://www.minitab.com/en-us/support/installation/)
- [Support Videos](https://www.minitab.com/en-us/support/videos/)
- [Support Documentation](https://www.minitab.com/en-us/support/documents/)
- [Software Updates](https://www.minitab.com/en-us/support/software-updates/)
- [Product Downloads](https://www.minitab.com/en-us/support/downloads/)
- [Support Policy](https://www.minitab.com/en-us/support/policy/)
- Company
Back
[Company](https://www.minitab.com/en-us/company/)
[Company](https://www.minitab.com/en-us/company/)
- [About Us](https://www.minitab.com/en-us/company/our-company/)
- [Leadership Team](https://www.minitab.com/en-us/company/leadership-team/)
- [Partners](https://www.minitab.com/en-us/company/partners/)
- [Careers](https://www.minitab.com/en-us/company/careers/)
- [Contact](https://www.minitab.com/en-us/company/contact-us/)
- [News](https://www.minitab.com/en-us/company/press-releases/)
[Try/Buy](https://www.minitab.com/en-us/try-buy/)
- [Statistics](https://blog.minitab.com/en/blog/tag/statistics)
- [Data Analysis](https://blog.minitab.com/en/blog/tag/data-analysis)
-
- [Quality Improvement](https://blog.minitab.com/en/blog/tag/quality-improvement)
- [Subscribe](https://info.minitab.com/blog/subscribe?hsLang=en)

## Notice
You are now leaving minitab.com.
Click Continue to proceed to:
Continue
Go Back
# Creating a Waterfall Chart in Minitab
Minitab Blog Editor | 1/20/2017
Topics: [Data Analysis](https://blog.minitab.com/en/blog/tag/data-analysis), [Project Tools](https://blog.minitab.com/en/blog/tag/project-tools)
- [Share](https://www.linkedin.com/shareArticle?mini=true&url=https://blog.minitab.com/en/blog/creating-a-waterfall-chart-in-minitab)
- [Share](https://www.facebook.com/sharer.php?u=https://blog.minitab.com/en/blog/creating-a-waterfall-chart-in-minitab)
While there are many graph options available in [Minitab’s Graph menu](http://support.minitab.com/minitab/17/topic-library/basic-statistics-and-graphs/graphs/basics/graphs-in-minitab/), there is no *direct* option to generate a waterfall chart. This type of graph helps visualize the cumulative effect of sequentially introducing positive or negative values.
In this post, I’ll show you the steps to follow to make Minitab display a waterfall chart even without a "waterfall chart" tool. If you don’t already have Minitab, you can download a free 30-day trial [here](http://www.minitab.com/en-us/products/minitab/free-trial/).
For the purpose of this post, I’ll replicate this sample waterfall chart that I found in Wikipedia:
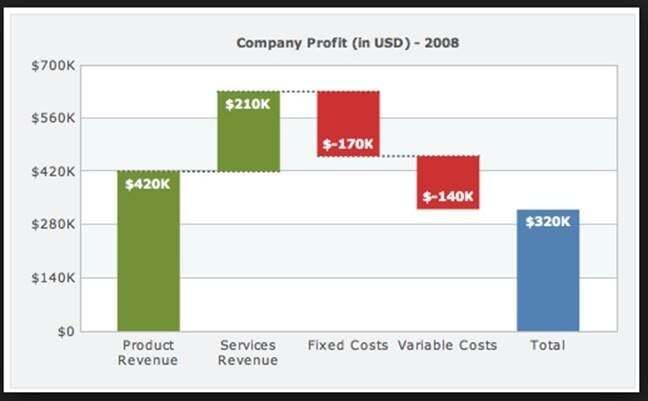
In Minitab, we’ll need to set up the data in table form. Here is how I’ve set up the data in my Minitab worksheet:
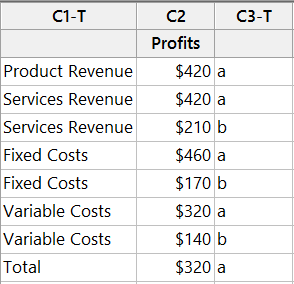
The tricky part is adding and subtracting to make sure that each section on each of the five bars is the right height. For example, the height of the *Services Revenue* bar is 630 (that’s 420 + 210 = 630).
To make the *Fixed Costs* bar reflect a $170 decrease from $630, we enter *Fixed Costs* twice in the worksheet with values of 460 and 170 (that’s 630 - 170 = 460). We will sum the two values together when we create the bar chart, and we will use column C3 to make one bar with two sections representing those two values.
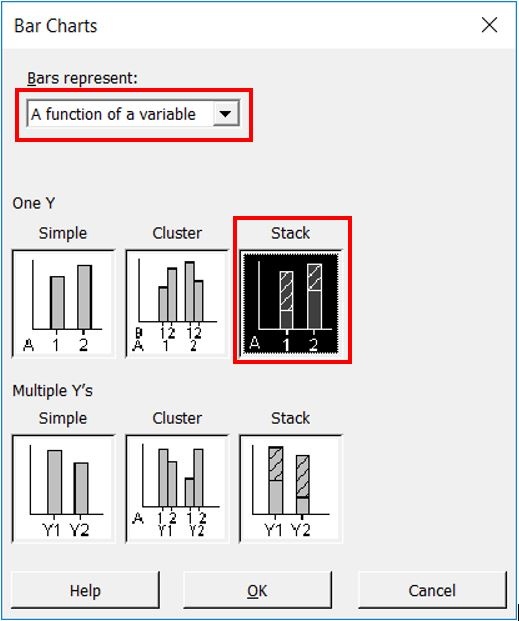
To make the graph, go to **Graph** > **Bar chart** > **A function of a variable** > **One Y Stack**:
Complete the new window like this:
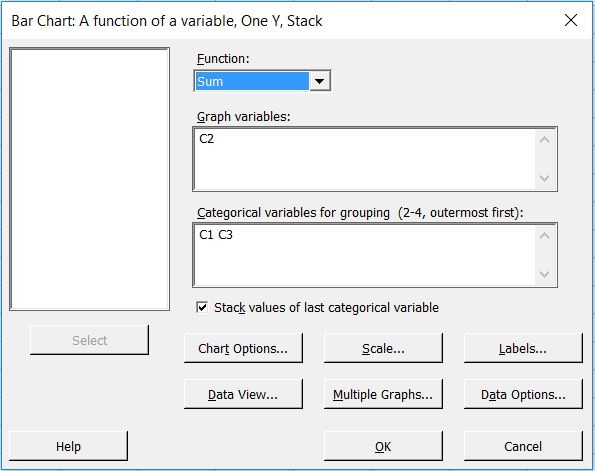
When you click **OK** in the window above, Minitab will create a graph that looks similar to the one below:
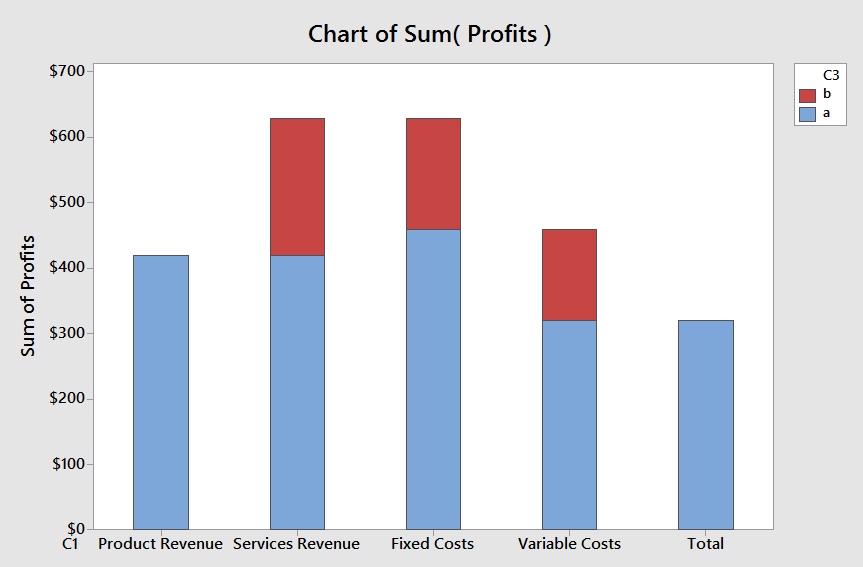
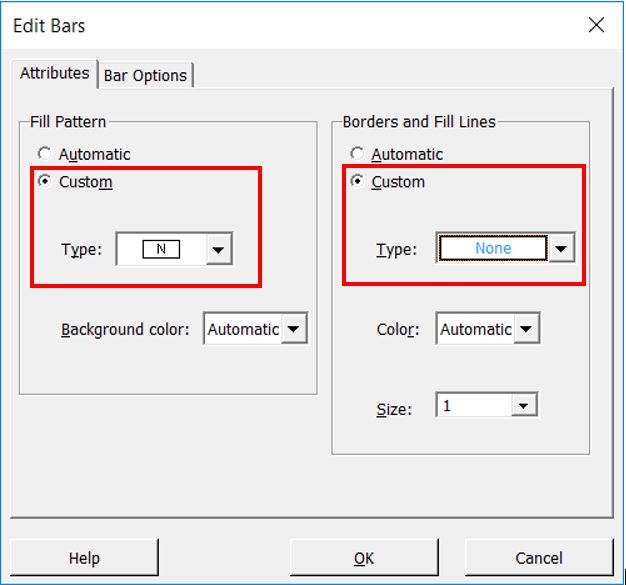
To get the final waterfall chart, the graph above will need to be manually edited. In the example below, I’ve hidden the sections of the bar chart that I don’t want to see. To hide a section of the bar chart, make sure only that section is selected (single-click on the bar you want to edit until only that section is selected) and then double-click to bring up the **Edit Bars** window. Next, make the selections show in the image below:
In the example below, I repeated the steps above to remove the section of each bar that I wanted to hide. I’ve also manually deleted the legend:
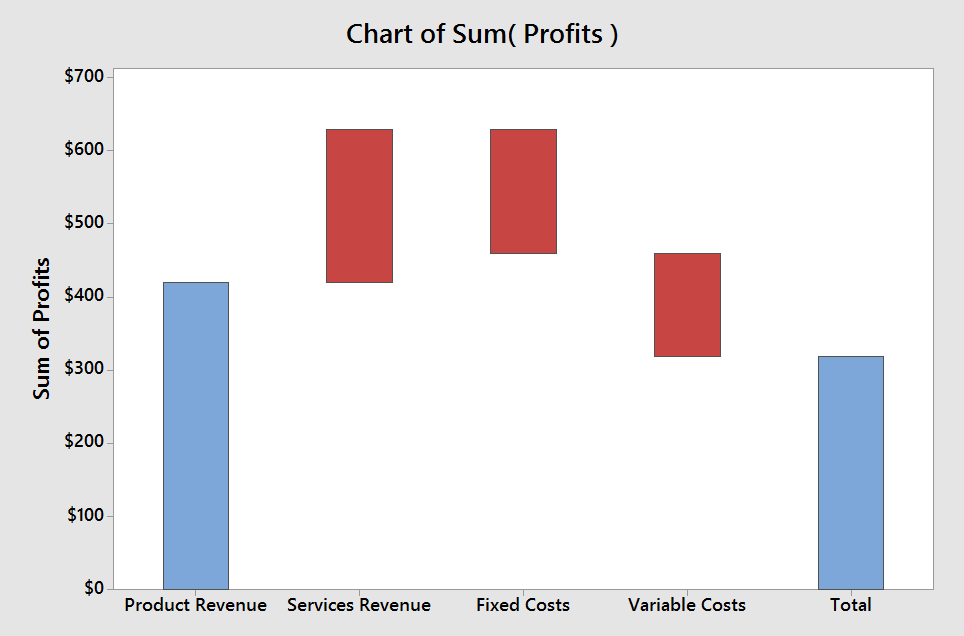
The graph above is almost ready, but to match our initial example I’ll make a few more manual edits as detailed below:
1. Delete the Y-axis Label **Sum of Profits** by clicking on the label and using the Delete key on the keyboard. I also changed the title of the graph by clicking on the current title and typing in the title I wanted to see.
2. Adjust the Y-axis tick labels to the values in the example by double-clicking on the Y-axis scale to bring up the **Edit Scale** window, selecting **Position of ticks** and typing in the values I’d like to see on the Y-axis: 0, 140, 280, 420, 560, 700.
3. Manually change the colors of the **Product Revenue** and **Services Revenue** to green by selecting each bar individually, double-clicking to bring up the **Edit Bars** window and changing the Fill **Pattern Background color**.
4. Add horizontal gridlines by right-clicking on the graph and choosing **Add** > **Gridlines** and selecting **Y major ticks**. I also double-clicked on one of the gridlines to bring up the **Edit Gridlines** window and changed the **Major Gridlines** to **Custom** and selected a solid line (instead of the default dotted line) so I could match the example more closely.
5. Use the **Graph Annotation** toolbar to insert a text box (look for a button that looks like a capital **T** in the toolbars at the top), placing the text box for each bar where I want to see it, typing in the value I want to display ($420K, $210K, $-170K, etc.), and clicking **OK**. Finally, I double-clicked on each label to bring up the **Edit Text** window where I used the **Font** tab to change the font color from black to white.
The final result looks very much like the example shown at the beginning of this post:
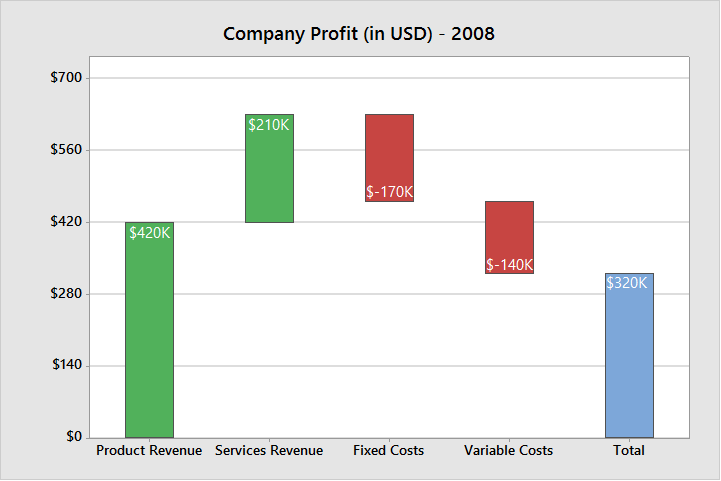
I hope you’ve enjoyed reading this post! For more information about editing graphs in Minitab 17, take a look at [this online support page](http://support.minitab.com/en-us/minitab/17/topic-library/basic-statistics-and-graphs/graphs/basics/edit-graphs/).
## You Might Also Like
[New Minitab Updates Unite Data Collection, Preparation, and Predictive Analytics](https://blog.minitab.com/en/blog/new-minitab-updates-unite-data-collection-preparation-and-predictive-analytics?hsLang=en)
[Data Preparation](https://blog.minitab.com/en/blog/tag/data-preparation) | 5 Minute Read
[Artemis II Heat Shield: How Do You Decide in Uncertain Conditions?](https://blog.minitab.com/en/blog/artemis-ii-heat-shield-how-do-you-decide-under-uncertainty?hsLang=en)
[Data Analysis](https://blog.minitab.com/en/blog/tag/data-analysis) | 4 Minute Read
[6 Trends Shaping Business Decisions in 2026](https://blog.minitab.com/en/blog/6-trends-shaping-business-decisions-in-2026?hsLang=en)
[Oee](https://blog.minitab.com/en/blog/tag/oee) | 8 Minute Read
---
- [Careers](https://www.minitab.com/en-us/company/careers/)
- [Trust Center](https://www.minitab.com/en-us/trust-center/)
- [Suppliers](https://www.minitab.com/en-us/suppliers/)
- [Site Map](https://www.minitab.com/en-us/site-map/)
- [](https://www.linkedin.com/company/minitab/)
- [](https://www.facebook.com/Minitab/)
- [](https://www.youtube.com/user/MinitabInc)
- [](https://www.instagram.com/minitab/)
---
© 2025 Minitab, LLC. All Rights Reserved.
- [Terms of Use](https://www.minitab.com/en-us/legal/terms-of-use/)
- [Privacy Policy](https://www.minitab.com/en-us/legal/privacy-policy/)
- [Legal](https://www.minitab.com/en-us/legal/)
- Cookies Settings