


If you’re familiar with Lean Six Sigma, then you’re familiar with DMAIC.
DMAIC is the acronym for Define, Measure, Analyze, Improve and Control. This proven problem-solving strategy provides a structured 5-phase framework to follow when working on an improvement project.
This is the first post in a five-part series that focuses on the tools available in Minitab Statistical Software that are most applicable to each phase, beginning with Define.
The DEFINE Phase Defined
DMAIC begins once you have identified a problem to solve. The goal of this first phase is to define the project goals and customer deliverables. This includes developing a problem statement and identifying objectives, resources and project milestones.
Cause-and-Effect Diagram
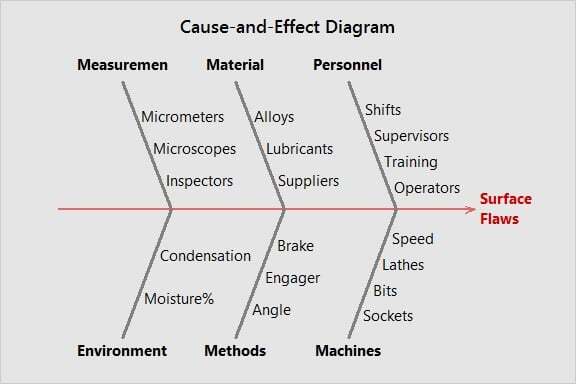
Also known as a fishbone (because it resembles a fish skeleton) or Ishikawa (named after its creator Kaoru Ishikawa) diagram, this graphical brainstorming tool can help you and your team organize and investigate possible causes of a problem.
In a C&E diagram, the problem is identified on the far right, while the causes are arranged into major categories. For manufacturing applications, categories may include Personnel, Machines, Materials, Methods, Measurements, and Environment. Service applications often include Personnel, Procedures, and Policies.
Minitab location: Stat > Quality Tools > Cause-and-Effect
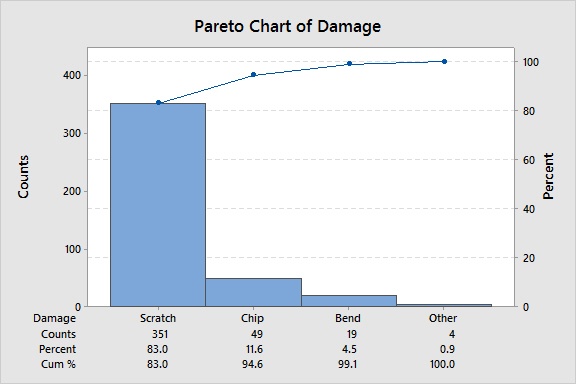
Pareto Chart
A Pareto chart is a basic quality tool used to highlight the most frequently occurring defects, or the most common causes for a defect.
This specialized type of bar chart is named for Vilfredo Pareto and his 80-20 rule. By ordering the bars from largest to smallest, a Pareto chart can help you separate the "vital few" from the "trivial many." These charts reveal where the largest gains can be made.
Minitab location: Stat > Quality Tools > Pareto Chart
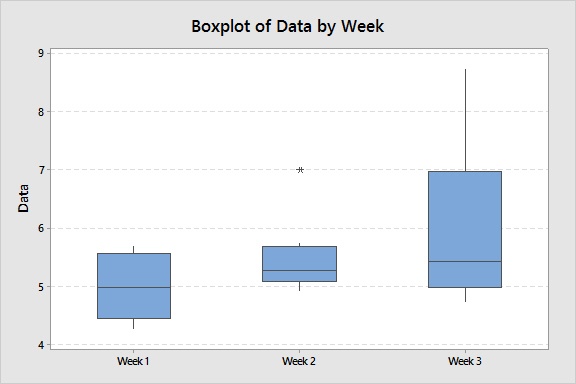
Boxplot
Also known as a box-and-whisker plot, the boxplot shows you how a numeric, continuous variable is distributed, including its shape and variability. You can create a single boxplot for a single data set, or you can create multiple boxplots to compare multiple data sets. Boxplots also help you identify outliers.
Minitab location: Graph > Boxplot
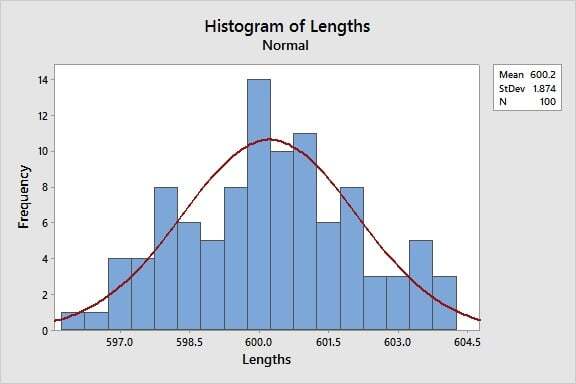
Histogram
Like boxplots, histograms reveal the shape and spread of a data set, and can help you assess if your data follow a normal distribution, are left-skewed, right-skewed, unimodal, etc.
Histograms divide data into bins of a given range plotted along the horizontal x-axis, and display the number of data points within each bin on the vertical y-axis.
Minitab location: Graph > Histogram
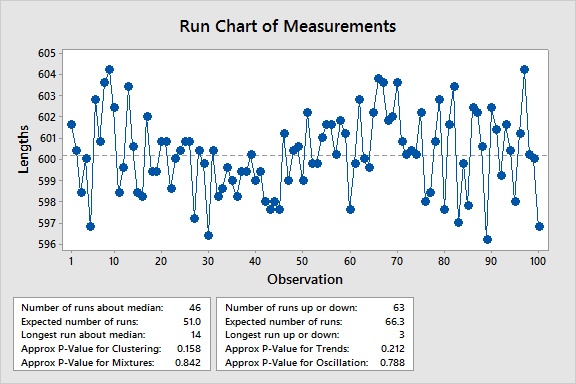
Run Chart
Run charts graph your data over time, presuming it was collected and recorded in chronological order. This special type of time series plot can be used to determine if there are any patterns and non-random behavior in your process, such as trends, oscillation, mixtures and clustering.
Minitab location: Stat > Quality Tools > Run Chart
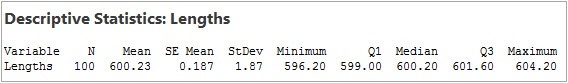
Descriptive Statistics
This is the first non-graphical tool in this post. This tool provides a summary of your data, and can include such statistics as the mean, median, mode, minimum, maximum, standard deviation, range, etc.
Minitab location: Stat > Basic Statistics > Display Descriptive Statistics
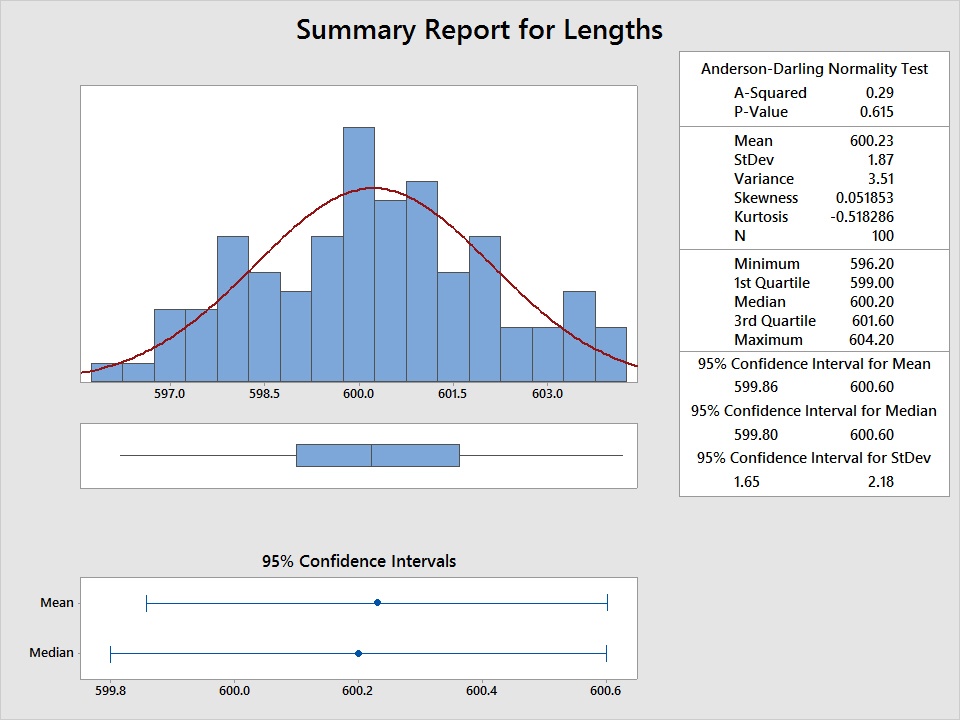
Graphical Summary
This Minitab feature provides a comprehensive summary for a numeric, continuous dataset, including a histogram, boxplots, descriptive statistics, and more. It offers a comprehensive snapshot of your data and includes tests for normality, the mean, and the median.
Minitab location: Stat > Basic Statistics > Graphical Summary
No Two Projects are Created Equal
While this post focuses on the Define tools available in Minitab, other Define tools—such as the project charter and SIPOC—are available in Minitab Engage. Not every project includes the same exact set of tools, so it’s quite possible that a given Define phase for a given project includes only a few of the tools above. Moreover, not all tools discussed above are used solely within the Define phase of DMAIC. For example, histograms may also be used in other phases.
The tools you will use within each phase depend upon the type of project you’re working on, leadership preferences, and what types of tools best communicate your data and the problem you’re trying to solve.