You run a capability analysis and your Cpk is bad. Now what?
First, let’s start by defining what “bad” is. In simple terms, the smaller the Cpk, the more defects you have. So the larger your Cpk is, the better. Many practitioners use a Cpk of 1.33 as the gold standard, so we’ll treat that as the gold standard here, too.
Suppose we collect some data and run a capability analysis using Minitab Statistical Software. The results reveal a Cpk of 0.35 with a corresponding DPMO (defects per million opportunities) of more than 140,000. Not good. So how can we improve it? There are two ways to figure that out:
#1 Look at the Graph
Example 1: The Cpk for Diameter1 is 0.35, which is well below 1.33. This means we have a lot of measurements that are out of spec.
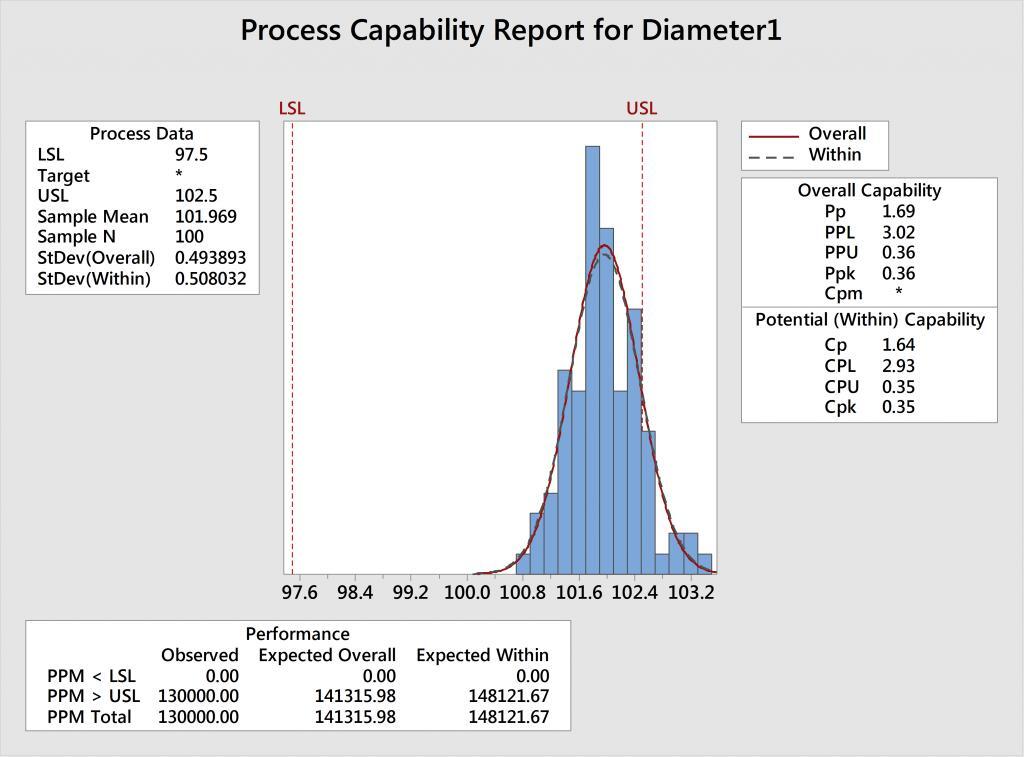
Using the graph, we can see that the data—represented by the blue histogram—is not centered between the spec limits shown in red. Fortunately, variability does not appear to be an issue since the histogram and corresponding normal curve can physically fit between the specification limits.
Q: How can we improve Cpk?
A: Center the process by moving the mean closer to 100 – halfway between the spec limits – without increasing the variation.
Example 2: In the analysis for Diameter2, we see a meager Cpk of only 0.41. Fortunately, the data is centered relative to the spec limits. However, the histogram and corresponding normal curve extend beyond the specs.
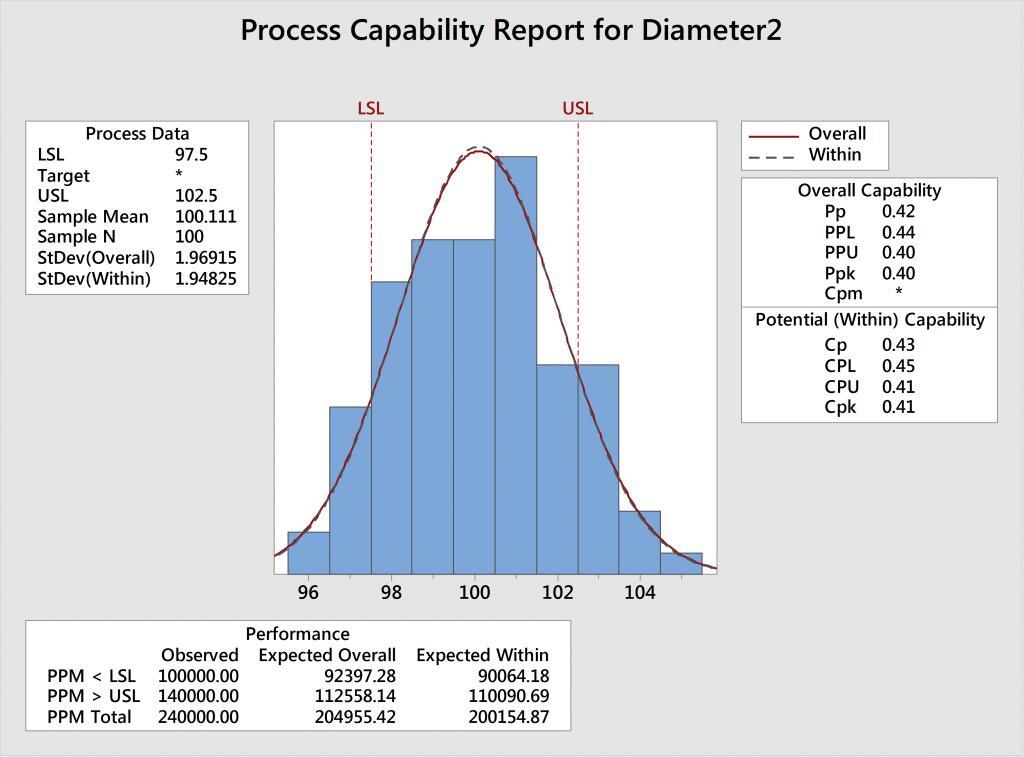
Q: How can we improve Cpk?
A: Reduce the variability, while maintaining the same average.
Example 3: In the analysis for Diameter3, we can see that the process is not centered between the specs. To make matters worse, the histogram and corresponding normal curve are wider than the tolerance (i.e. the distance between the spec limits), which indicates that there’s also too much variability.
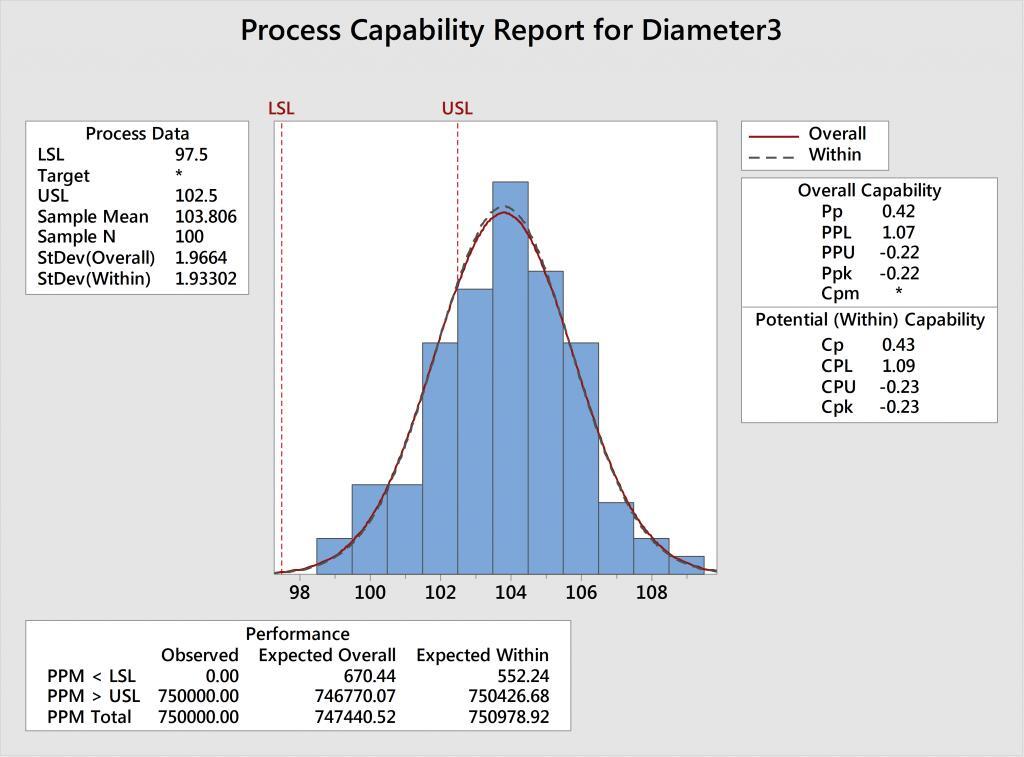
Q: How can we improve Cpk?
A. Shift the mean closer to 100 to center the process AND reduce the variation.
#2 Compare Cp to Cpk
Cp is similar to Cpk in that the smaller the number, the worse the process, and we can use the same 1.33 gold standard. However, the two statistics and their corresponding formulas differ in that Cp only compares the spread of the data to the tolerance width, and does not account for whether or not the process is actually centered between the spec limits.
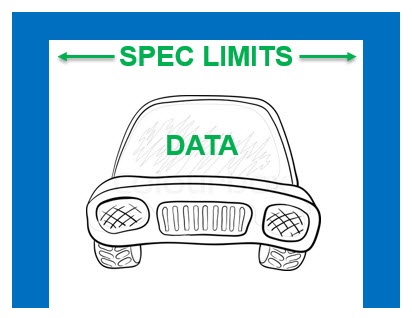
Interpreting Cp is much like asking “will my car fit in the garage?” where the data is your car and the spec limits are the walls of your garage. We’re not accounting for whether or not you’re a crappy driver and can actually drive straight and center the car—we’re just looking at whether or not your car is narrow enough to physically fit.
Example 1: The analysis for Diameter1 has a Cp of 1.64, which is very good. Because Cp is good, we know the variation is acceptable—we can physically fit our car in the garage. However, Cpk, which does acccount for whether or not the process is centered, is awful, at only 0.35.
Q: How can we improve Cpk?
A: Shift the mean to center the process between the specs, without increasing the variation.
Example 2: The analysis for Diameter 2 shows that Cp = 0.43 and Cpk = 0.41. Because Cp is bad, we know there’s too much variation—our car cannot physically fit in the garage. And because the Cp and Cpk values are similar, this tells us that the process is fairly centered.
Q: How can we improve Cpk?
A: Reduce the variation, while maintaining the same average.
Example 3: The analysis for Diameter 3 has a Cp = 0.43 and Cpk = -0.23. Because Cp is bad, we know there’s too much variation. And because Cp is not even close to Cpk, we know that the process is also off center.
Q: How can we improve Cpk?
A. Shift the mean AND reduce the variation.
And for a 3rd way...
Whether you look at a capability analysis graph or compare the Cp and Cpk statistics, you’re going to arrive at the same conclusion regarding how to improve your results. And if you want yet another way to figure out how to improve Cpk, you can also look at the mean and standard deviation—but for now, I’ll spare you the math lesson and stick with #1 and #2 above.
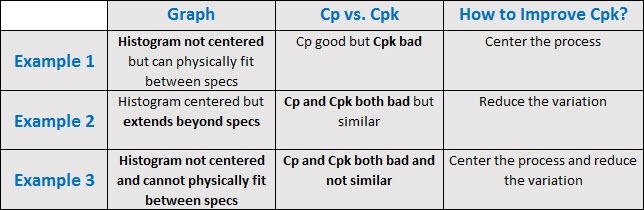
In summary: