


To choose the right statistical analysis, you need to know the distribution of your data. Suppose you want to assess the capability of your process. If you conduct an analysis that assumes the data follow a normal distribution when, in fact, the data are nonnormal, your results will be inaccurate. To avoid this costly error, you must determine the distribution of your data.
So, how do you determine the distribution? Minitab’s Individual Distribution Identification is a simple way to find the distribution of your data so you can choose the appropriate statistical analysis. You can use it to:
- Determine whether a distribution you used previously is still valid for the current data
- Choose the right distribution when you’re not sure which distribution to use
- Transform your data to follow a normal distribution
Let's take a closer look at three ways you can use the Individual Distribution Identification tool in our statistical software.
Confirm a Certain Distribution Fits Your Data
In most cases, your process knowledge helps you identify the distribution of your data. In these situations, you can use Minitab’s Individual Distribution Identification to confirm the known distribution fits the current data.
Suppose you want to perform a capability analysis to ensure that the weight of ice cream containers from your production line meets specifications. In the past, ice cream container weights have been normally distributed, but you want to confirm normality. Here’s how you use Individual Distribution Identification to quickly assess the fit.
- Choose Stat > Quality Tools > Individual Distribution Identification.
- Specify the column of data to analyze and the distribution to check it against.
- Click OK.
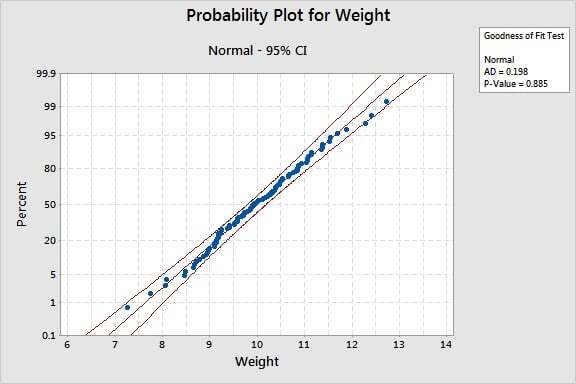
A given distribution is a good fit if:
- The data points roughly follow a straight line
- The p-value is greater than 0.05
In this case, the ice cream weight data appear to follow a normal distribution, so you can justify using normal capability analysis.
Determine Which Distribution Best Fits Your Data
Perhaps you have successfully used more than one distribution in the past. You can use Individual Distribution Identification to help you decide which distribution best fits your current data. For example, you want to assess whether a particular weld strength meets customers’ requirements, but several distributions have been used to model this data historically. Here’s how you use Individual Distribution Identification to choose the distribution that best fits your current data.
- Choose Stat > Quality Tools > Individual Distribution Identification.
- Specify the column of data to analyze and the distributions to check it against.
- Click OK.
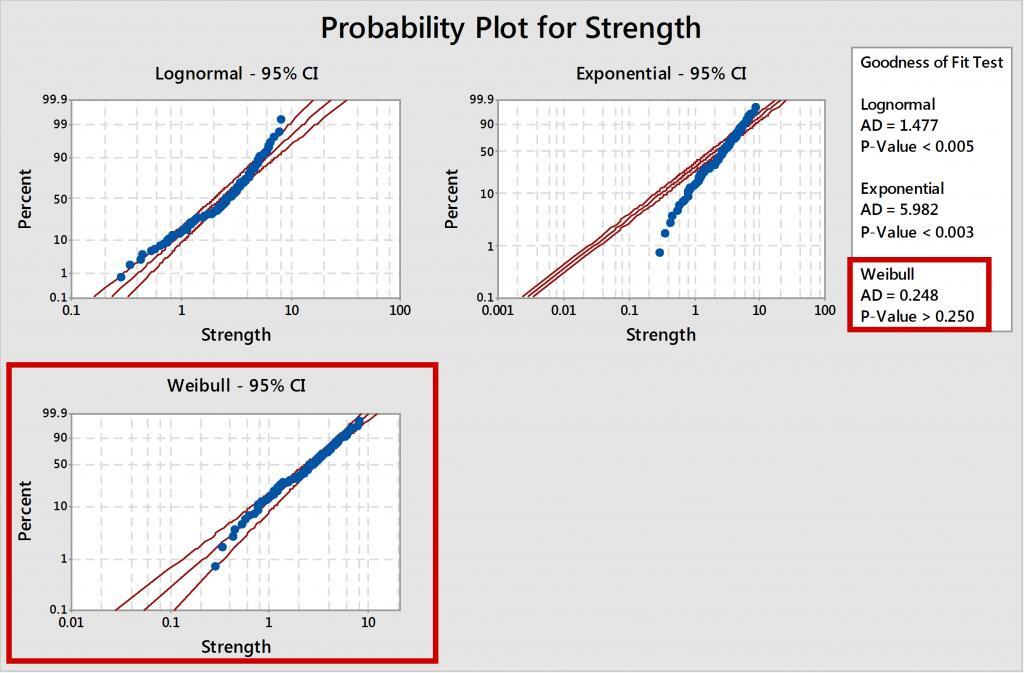
Choose the distribution with data points that roughly follow a straight line and the highest p-value. In this case, the Weibull distribution fits the data best.
Note
When you fit your data with both a 2-parameter distribution and its 3-parameter counterpart, the latter often appears to be a better fit. However, you should use a 3-parameter distribution only if it is significantly better. See Minitab Help for information about choosing between a 2-parameter distribution and a 3-parameter distribution.
Use a Normal Statistical Analysis on Nonnormal Data
While Minitab offers various options for analysis of nonnormal data, many users prefer to use the broader palette of normal statistical analyses. Minitab’s Individual Distribution Identification can transform your nonnormal data using the Box-Cox method so that it follows a normal distribution. You can then use the transformed data with any analysis that assumes the data follow a normal distribution.
- Choose Stat > Quality Tools > Individual Distribution Identification.
- Specify the column of data to analyze.
- From the Distribution drop-down menu in the main dialog, choose Box-Cox transformation, and select any other distributions to compare it with.
- Click OK in each dialog box.
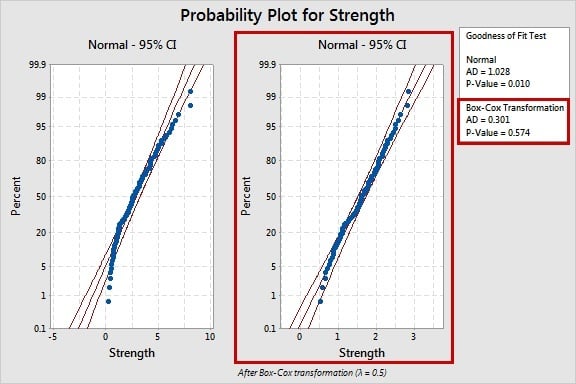
For the transformed data, check for data points that roughly follow a straight line and a p-value greater than 0.05.
In this case, the probability plot and p-value suggest the transformed data follow a normal distribution. You can now use the transformed data for further analysis.
Note
Data transformations will not always produce normal data. You must check the probability plot and p-value to assess whether the normal distribution fits the transformed data well.
Putting Individual Distribution Identification to Use
It is always good practice to know the distribution of your data before choosing a statistical analysis. Minitab’s Individual Distribution Identification is an easy-to-use tool that can help you identify the distribution of your data as well as eliminate errors and wasted time that result from an inappropriate analysis.
You can use this feature to check the fit of a single distribution, or to compare the fits of several distributions and select the one that best fits your data. If you prefer to work with normal data, you can even use Minitab’s Individual Distribution Identification to transform your nonnormal data to see if they follow a normal distribution.