


Reliability analysis is the perfect tool for calculating the proportion of items that you can expect to survive for a specified period of time under identical operating conditions. Light bulbs—or lamps—are a classic example. Want to calculate the number of light bulbs expected to fail within 1000 hours? Reliability analysis can help you answer this type of question.
But to conduct the analysis properly, we need to understand the difference between the three types of censoring.
What is censored data?
When you perform reliability analysis, you may not have exact failure times for all items. In fact, lifetime data are often "censored." Using the light bulb example, perhaps not all the light bulbs have failed by the time your study ends. The time data for those bulbs that have not yet failed are referred to as censored.

It is important to include the censored observations in your analysis because the fact that these items have not yet failed has a big impact on your reliability estimates.
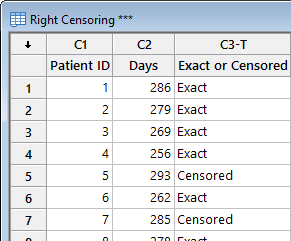
Right-censored data
Let’s move from light bulbs to newborns, inspired by my colleague who’s at the “you’re still here?” stage of pregnancy.
Suppose you’re conducting a study on pregnancy duration. You’re ready to complete the study and run your analysis, but some women in the study are still pregnant, so you don’t know exactly how long their pregnancies will last. These observations would be right-censored. The “failure,” or birth in this case, will occur after the recorded time.
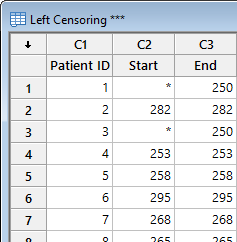
Left-censored data
Now suppose you survey some women in your study at the 250-day mark, but they already had their babies. You know they had their babies before 250 days, but don’t know exactly when. These are therefore left-censored observations, where the “failure” occurred before a particular time.
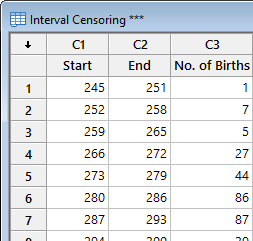
Interval-censored data
If we don’t know exactly when some babies were born but we know it was within some interval of time, these observations would be interval-censored. We know the “failure” occurred within some given time period. For example, we might survey expectant mothers every 7 days and then count the number who had a baby within that given week.
Once you set up your data, running the analysis is easy with Minitab Statistical Software. For more information on how to run the analysis and interpret your results, see this blog post, which—coincidentally—is baby-related, too.
Case study:
Time-to-Market and Design for Reliability at the Speed of Light in Signify
Get ready for a light bulb moment! In a fast-changing industry where time-to-market and product reliability give a competitive edge, discover how the world’s leading lighting company Signify, rapidly validates new innovations. In this one hour webinar, Prof W.D. van Driel and Dr P. Watté will shed a light on design for reliability (DfR) using Minitab Statistical Software at Signify, the former Philips Lighting. Learn from real-life examples their methods to lower your development costs, improve your designs’ performance and compliance, and accelerate the testing of product design reliability. If you develop products intended to meet high specifications for years to come, you will discover how to reduce the risks and consequences of product failure and costly claims - for you and your customers.

![[Webinar Replay] Time-to-Market and Design for Reliability at the Speed of Light at Signify](https://no-cache.hubspot.com/cta/default/3447555/b70a5a3e-03b6-408b-bbc1-7851ef13e4e9.png)