


In Part 1 of this blog series, I compared Six Sigma to a diamond because both are valuable, have many facets and have withstood the test of time. I also explained how the term “Six Sigma” can be used to summarize a variety of concepts, including philosophy, tools, methodology, or metrics. In this post, I’ll explain short/long-term variation and between/within-subgroup variation and how they help the Six Sigma practitioner to understand process performance.
Short/Long-Term Variation
In a nutshell, short-term or within-subgroup variation is data collected over a short period of time. Long-term or overall variation is data collected over a longer period. Makes perfect sense right?
Let’s start with the within-subgroup variation. The within-subgroup variation is the variation among measurements in a single subgroup. It represents the natural and inherent variation of the process over a short period of time. Within-subgroup variation will not be influenced by changes to the process inputs, such as different operators, changes in machine settings, or tool wear. When your process is evaluated using within-subgroup variation, you are asking the question: Does my current production sample meet specifications?
In figure 1 below, the within-subgroup variation is represented by the smaller histograms. As you can see, there are multiple subgroups in this data set:
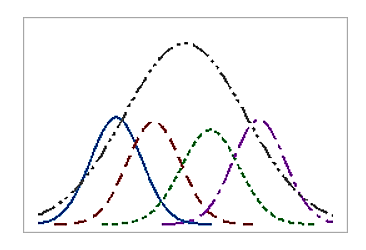
Figure 1
The within-subgroup variation is estimated by the within-subgroup standard deviation. Minitab calculates σwithin using one of the following methods:
- Pooled standard deviation
- Average of subgroup ranges (Rbar)
- Average of subgroup standard deviations (Sbar)
The large overarching histogram in the figure above represents the overall variation, which is the within-subgroup variation combined with the variation that occurs among subgroups that are collected over a longer period of time.
The overall variation includes changes to process inputs or to the environment, such as fluctuations in temperature or changes in material. The general rule of thumb for overall variation is that it contains data collected over a sufficient time such that over 80% of the process variation is likely to be included.
The overall variation is estimated by the overall standard deviation. When you evaluate your process using overall variation, you are asking the question: Does my process in the long run meet specification?
Figure 2 displays data from an engine manufacturer using a forging process to make piston rings. The quality engineers want to assess the process capability. Over the span of two weeks, they collect 25 subgroups of five piston rings and measure the diameters. The specification limits for piston ring diameter are 74.0 mm ± 0.05 mm.
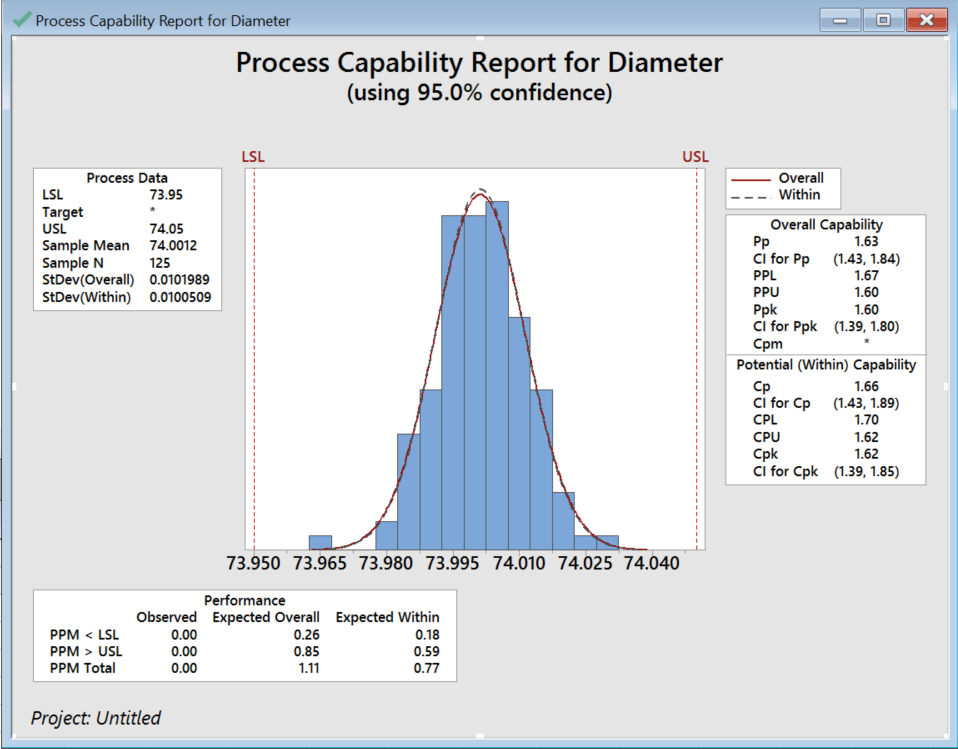
Figure 2
Most capability assessments are grouped into one of two categories: potential (within) and overall capability. Each represents a unique measure of process capability. Potential capability is often called the "entitlement" of your process! It ignores differences between subgroups and represents how the process could perform if the shift and drift between subgroups are eliminated. Capability indices that assess potential capability include Cp, CPU, CPL, and Cpk.
The overall capability is what the customer experiences! It explains the differences between subgroups. Capability indices that assess overall capability include Pp, PPU, PPL, and Ppk.
You can assess the effect of variation between subgroups by comparing potential and overall capability. If the difference between them is large, there is likely a high amount of variation between the subgroups, and the stability of your process can be improved. If Cp and Cpk, and Pp and Ppk are the same, then you have a centered process, and one that has very little variation.
Between/Within Variation
Between-group variation is the variation due to the interaction between the subgroups. If the subgroup means are close to each other, the between variation will be small for different shifts, machines, or operators.
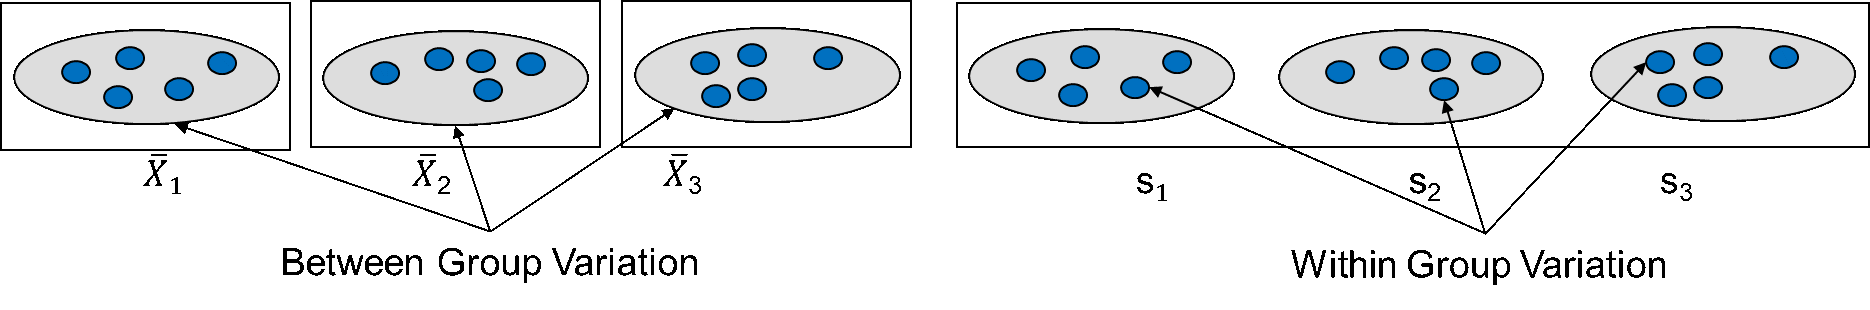
Figure 3
Within-group variation is the variation due to differences within individual samples. It is the random variation that we expect from noise or statistical error. Each sample is considered independently, and no interaction between samples is involved (because we're looking at a sample from one worker, one shift, or one batch). To improve process quality, try to eliminate the between-subgroup variation and the reduce within-subgroup variation.
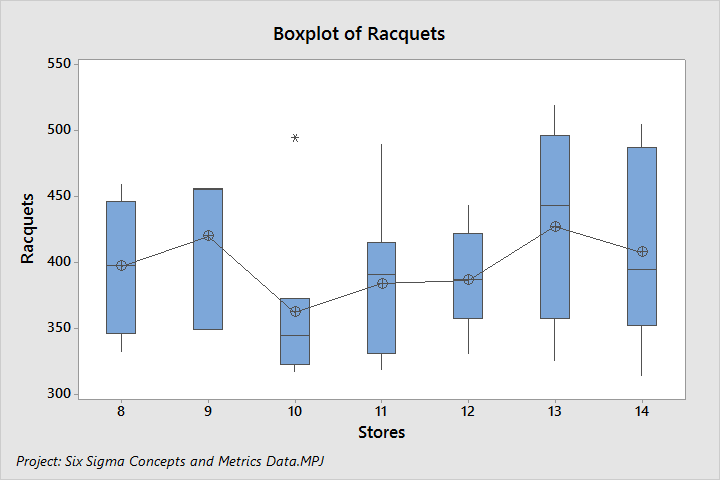
Figure 4
To demonstrate between- and within-subgroup variation, Figure 4 displays racquet sales data for seven stores on a boxplot. The length of the bars in the boxplot represent the within-subgroup variation. The store with the most within-subgroup variation is #13, while the store with the least amount of within-subgroup variation, at first glance, is store #10—but it has an outlier. Therefore, store #12 has the least amount of within-subgroup variation.
The between-subgroup variation is evaluated by comparing the mean (X-bar) between the stores. If the means are close to each other, the between variation calculation will be small.
ANOVA is a statistical method to compare three or more subgroups to determine if the subgroups are statistically the same or different. The F-Value is calculated using the between- and within-subgroup variation. If more variation is coming from within, then the subgroups are considered statistically the same. Conversely, if more variation is due to differences between subgroups, they are considered statistically different.
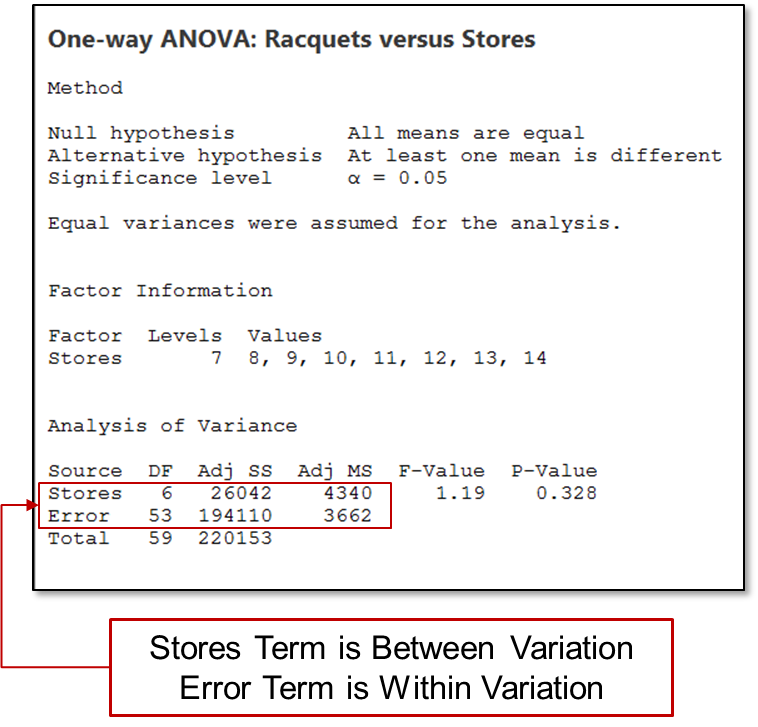
Figure 5
Figure 5 shows the ANOVA table for the Racquet sales analysis for the seven stores. The stores term represents the between-subgroup variation and the error term represents the within-subgroup variation. After calculating the sum square and mean square, the F-value and P-value are calculated and used to determine the results. Since the F-value is close to 1 and the p-value is >0.05, the stores sales are considered not statistically different.
As you work to improve quality, be sure you recognize the differences between short/long-term variation and between/within-subgroup variation, and how they can help you understand process performance.