In ancient times dragons were believed to be set by the gods to guard golden treasures. This is because dragons were the most fearsome creatures and would deter would-be thieves. Dragons typically lived in an underground lair or castle and would sleep on top of their gold and treasures. They were terrifying and often depicted as large fire-breathing, scaly creatures with wings and a huge deadly spiked tail. One blow from its tail or fire-breath meant doom for any hopeful knight trying to slay this evil beast!
Just as dragons guarded their treasure, so do process steps guard their waste and excess inventory. Like dragons, these steps lay hidden, deep in the process, and fiercely defend their territory. They defy change and are experts at diverting attention to other parts of the process. They go by names such as Over-production, Over-processing, Waiting, Rework Loops, Defects, and Excess Inventory. There are costs associated with these steps too: acquiring and storing excess raw materials, warehousing partially or fully finished inventory, spare equipment, and maintaining that equipment, to name just a few.
 How do you find and then slay these process dragons? You need a knight in shining armor to come to your rescue and slay the crafty dragons! A process improvement practitioner has the right tools and techniques, and—with the help of a knowledgeable team—can generate a map that reveals just where the dragons lurk. Typically, quality professionals have been trained in the traditional DMAIC problem-solving methodology and have a trusty sidekick, such as Minitab Engage®, to help.
The Value Stream Map (VSM) will be one of the most useful tools for finding hidden process waste. The VSM illustrates the flow of materials and information as a product or service moves through the value stream. A value stream is the collection of all activities, both value-added and non-value added that generate a product or service required to meet customer needs.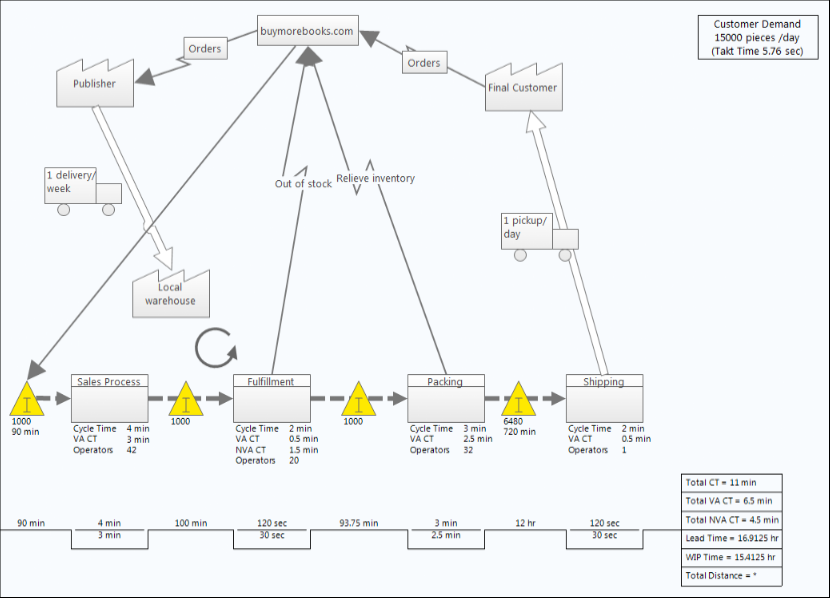
A current-state value stream map identifies waste and helps you to envision an improved future state. Minitab Engage® has an easy-to-use VSM tool and other tools that make the process improvement journey fun. As you work through the process of mapping the steps, calculating takt times and value-add ratios, use the following three tips to uncover opportunities for improvements.
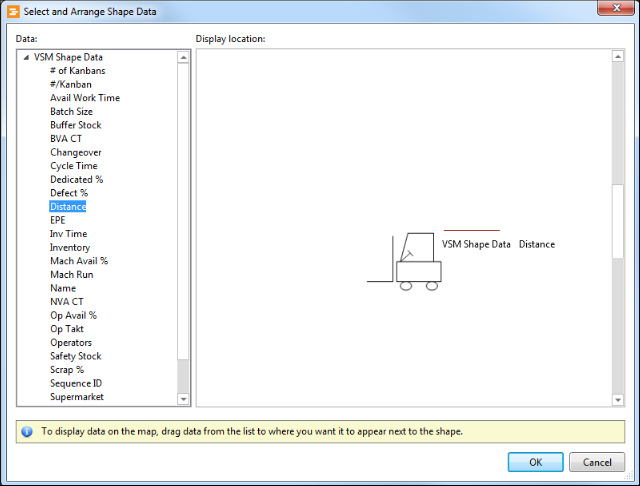
- By default, process shapes and inventory shapes display data on the map after you enter values for Cycle Time, VA CT, NVA CT, Changeover, Inventory and Inv Time. To display other data, use the Map > Data Display > Select and Arrange Shape Data dialog box, and drag a data field from the list to the shape. Release the mouse when you determine a location. The red line indicates where the data will be displayed beside the shape on the map.
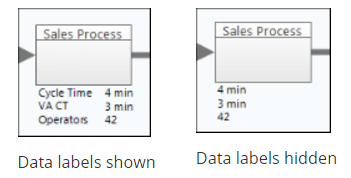
- If you prefer to hide some or all the data, you can select a shape and then choose Map > Data Display > Shape Data Labels. In this example, only the data labels are hidden.
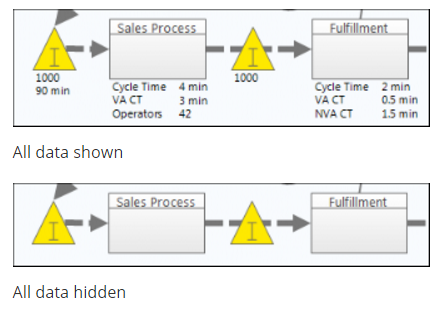
To hide all the shape data, choose Map > Data Display > Shape Data. In this example, the data labels, Cycle Time, VA CT, and Operators, and their values are hidden.
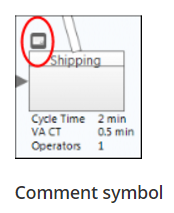
- Use comments fields to take notes. Simply click on the step and use the Comments field is in the task pane on the Other tab. The comment symbol, which is circled in the image, appears above the shape.
Many thanks to Dean Williams, Duke Energy for allowing me to use his ideas from the Slaying the Inventory Dragon presentation at the 2017 Lean and Six Sigma World Conference.


