


The cloud is everywhere, and its scope is expanding. In fact, Gartner forecasts worldwide public cloud end-user spending will reach nearly $600 billion in 2023. In the same report, Gartner reports overall IT spending is projected to grow 5.1% this year with the majority of new investments going into cloud technology. It’s an exciting and perfect time to adopt the cloud for all its benefits; improved agility and collaboration, a helpful boost with innovations, accelerated time to value and much more. Did you know you can move your quality initiatives into the cloud too?
If your organization is undergoing a digital transformation, don’t overlook migrating your quality programs into the cloud. It will result in time savings, waste reduction, and increase in overall revenue. Position yourself on a trajectory for growth and consider the cloud for quality too.
Cloud quality initiatives feed off cross-pollination of information and insights and are accessible to employees anywhere at any time. The ability to centralize quality data makes it easy to improve operations and reporting using minimal IT resources with no data center required and knowing the latest software updates and innovations will be automatically deployed. Minitab has powerful and easy to use tools that will enable you to take your quality programs into the cloud and ensure everyone across the organization has visibility into the initiatives taking place.
Quality Opportunities Across the Organization
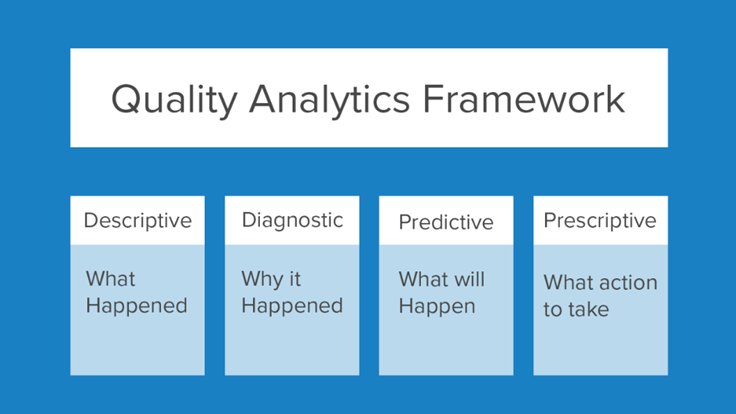
Minitab offers a broad array of quality tools for practitioners. Let’s explore quality improvement tools that are readily available in Minitab solutions that are designed to help you dive into and address the four framework factors below:
Problem-Solving with Engage
Minitab Engage fosters a collaborative quality program and is designed to help organizations build improvement and innovation programs in the cloud. Problem-solving tools and project management methodologies will track key performance metrics in real time to demonstrate ROI. Here are some examples:
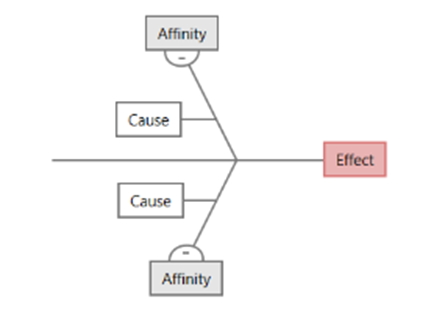
Fishbones, or cause-and-effect diagrams, help brainstorm potential causes of a problem and see relationships among potential causes to avoid problems and ensure quality results. On a fishbone diagram, the central problem, or effect, is on the far right. Affinities, which are categories of causes, branch from the spine of the central effect.
A Fishbone answers the following questions.
- What are the potential causes for a particular type of defect?
- What are the process inputs that contribute to variation in the process output?
 A process map, sometimes called a flow chart, can be used to help model process and understand and communicate all activities in the process, the relationships between inputs and outputs in the process, and key decision points. Engage makes it easy to construct high-level or detailed flow charts, and there’s also functionality to assign variables to each shape and then share them with other tools you’re using in Engage.
KYOCERA AVX, a Minitab customer moved their quality templates from Excel to Minitab Engage. Doing so increased visibility into the global quality projects happening at its various plants. Since everyone across the company was working from standardized templates there was better collaboration and information sharing. Engage also offers templates for 5S, A3, control plans, the 5 Whys, FMEA, and more.

Learn how KYOCERA AVX used Minitab Engage to standardize and improve customer communications.

Quality Tools in Minitab Statistical Software
Take a look at all of the quality tools and features included with Minitab Statistical Software. From control charts to capability analysis, you will find a tool to support your quality program.
Here are just a few of the analyses that can go a long way towards improving quality.
- Gage R&R can certify that the output is the same value as the input to ensure a company is making the right quality decisions.
- Pareto charts help uncover what is failing the most and acceptance sampling helps determine how many pieces of product should be quality tested before accepting the product from the supplier.
- Control charts are also very useful to verify processes are stable and ultimately reduce waste.
- Capability analyses can demonstrate quality in the processes being used.
- And if there is ever a doubt about which analysis to use, the Graph Builder visualizes data and explores graph alternatives. Based on the input, the Graph Builder displays a preview of available graph candidates.
As with Engage, Minitab Statistical Software runs in the cloud so it is easy to access anytime, anywhere, and share for easy collaboration. You can think of it this way, using Engage informs what data to collect, and Minitab analyzes that data to promote quality across an organization. They are a perfect complement to each other and will support your quality initiatives. We invite you to learn more!
