


When looking at a control chart, it’s important to know that the data we are looking at is accurate. Let’s face it, if the control limits we are looking at don’t really reflect what’s actually happening in our process, what does it matter if our points fall within the limits, or a little bit outside?
Let’s take a trip down to the widget factory, where widgets are being produced in all shapes and sizes. We’re going to take a look at one particular widget, and the time it takes for that particular widget to be produced (in minutes).
In a Minitab Statistical Software datasheet, we have two months (March and April) of observations in a column, let's say C2. We also have a date column, indicating the date on which the widget was produced. This information is contained in our first column, C1.
Let’s quickly create an individuals control chart in Minitab by going to Stat > Control Charts > Variable Charts for Individuals > Individuals. Here is what we get:
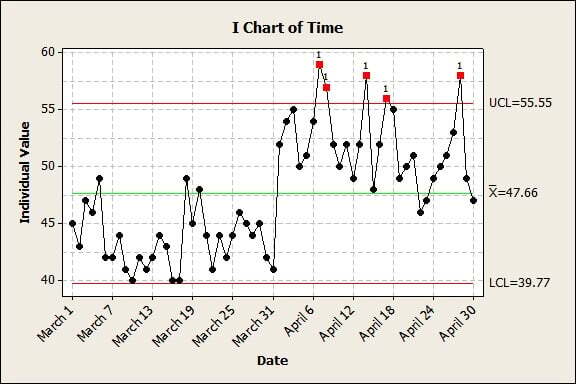
At first glance, it looks like we have some work to do, especially in the month of April. There seems to be a number of out of control points that warrant further investigation. In fact, we have five points alone that fall above the upper control limit, some by a considerable distance.
However, from our process knowledge, we know that on April 1 we made a process change that, while increasing the time spent to create widgets, greatly improved their quality. Using data from before the process change could throw off our estimates of the process afterwards. Therefore, it doesn’t really make sense to look at these data together.
We could create two different control charts, however, we are interested in seeing how our data look before AND after the process change was implemented. This is a perfect place to create what are known as stages. Essentially, we can get Minitab to estimate control limits differently for data points before and after the process change. In the I Chart menu, we can click ‘I Chart Options’ and navigate to the Stages tab.
This is how I filled out the dialog:
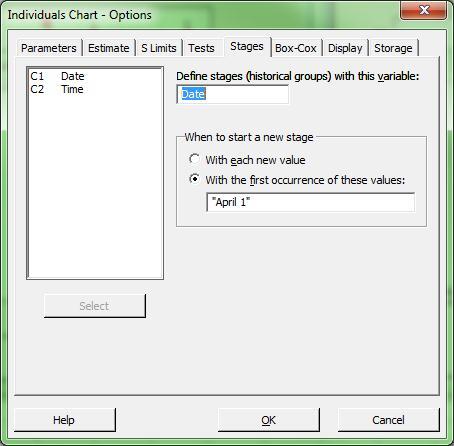
Using my Date column, I told Minitab to create a new stage at the specific values that I indicate. In our case, since I want to start a new stage, I just type "April 1" within quotes.
We now get the following control chart:
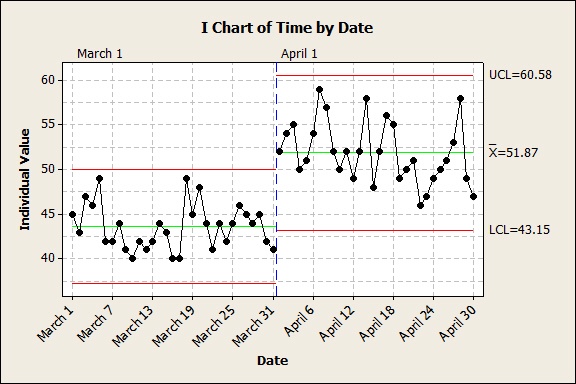
You'll notice the dashed blue line indicating the stage break. You can also see that Minitab has estimated a separate center line and control limits for each stage.
Now that we take into account that we have a known process change occurring on April 1, none of our data points are out of control! The five points we originally thought needed further investigation are actually in control, once we account for the process change that occurred. Because of this, it makes sense to estimate these data separately, and that’s what staging allowed us to do.