It’s a well-known fact that consumption of beer leads to improved statistical quality analysis.
Before you start pounding beers at your desk to get your p-values lower than alpha, let me explain. It’s a famous story in the history of statistics, and one that bears retelling for St. Patrick’s Day.
A Painstaking Process in the Land of Patricks
In the early 1900s, the Guinness Brewery in Dublin was the largest brewery in the world, churning out about 100 million gallons of beer each year to quench the collective thirst of the globe. Yet this huge production volume was tied to a very finicky brewing process.
Raw materials like hops, barley, and malt were extremely sensitive to how they were grown, processed, and stored. The fermentation process, which produced the alcohol in the beer, was unforgiving. Too much yeast could completely ruin a batch. Yet live yeast cultures were constantly growing and very difficult for workers to measure under a microscope. If the degree of saccharine in the malt extract was too low, the beer was weak. If it was too high, the beer was too strong and its stability and shelf life were compromised. There were a host of other variables as well.
If you were a brewer at Guinness, you had your hands full. You had to ensure that this large-scale, complex process was as economical as possible and yet still consistently produced a product of high quality. Sound familiar? Those push-pull objectives are the same ones faced by quality analysts over a century later.
Necessity and Beer: The Mothers of Statistics
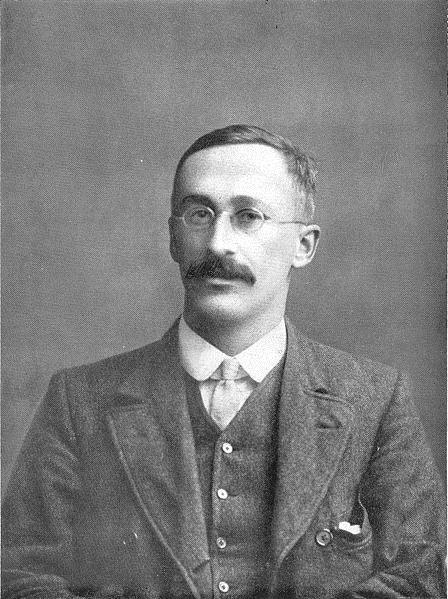
 Enter W. S. Gosset, who was hired as a brewer by Guinness in 1899. You have to love this guy. Despite having no formal training in statistics, Gosset quickly recognized that the brewing process could only be made stable, dependable, and profitable by using tools for quantitative analysis. Problem was, there weren’t any tools—or at least not the right tools—for the challenges he faced.
So, partly because he was “less scared of mathematics than the other brewers,” Gosset dove headlong into the study of statistics. Poring over texts, collaborating with leading statistical theorists, and tirelessly experimenting with the brewing process, Gosset developed an array of novel and innovative statistical analyses to ensure that every bottle of stout was a great bottle of stout. He:
- Devised a new method to handle random error when analyzing small samples
- Developed students t distribution and test for significance to compare means
- Modeled counts of yeast cells with the Poisson distribution
- Utilized balanced designs to maximize the power of detecting large treatment effects
Guinesss didn’t allow its brewers to publish, so Gosset published his pioneering findings under the pen name of Student (as if he were merely a “pupil” or “student” in the field of statistics). Over the years, the results of his hard work produced not only great beer, but much of the foundation for modern statistics and quality analysis.
So the next time you use a 2-sample t-test to compare your process means, you may want to hoist one in honor of W. S. Gosset and the Guiness Brewery, who made the statistical comparison possible.
Happy St. Pat’s!
References
JF Box. Guiness, Gosset, Fisher, and Small Samples. Statistical Science 1987; 2(1),45-52.
Ziliak ST. Gosset and Some Neglected Concepts in Experimental Statistics: Guinnessometrics II. Journal of Wine Economics 2011; 6(2):252-277.


