Right now I’m enjoying my daily dose of morning joe. As the steam rises off the cup, the dark rich liquid triggers a powerful enzyme cascade that jump-starts my brain and central nervous system, delivering potent glints of perspicacity into the dark crevices of my still-dormant consciousness.
Feels good, yeah! But is it good for me? Let’s see what the studies say…
- Drinking more than 4 cups of coffee per day is associated with a higher risk of death from all causes
- Drinking coffee is inversely associated with the mortality risk, with those drinking 4 cups a day having the lowest risk of death from all causes
- Drinking 2 to 4 cups of coffee a day is associated with a higher risk of cardiovascular disease
- Drinking 3.5 cups of coffee per day is associated with a lower risk of cardiovascular disease
Hmm. These are just a few results from copious studies on coffee consumption. But already I'm having a hard time processing the information.
Maybe another cup of coffee would help. Er...uh...maybe not.
The pivotal question you should ask before you perform any analysis
There are a host of possible explanations that might help explain these seemingly contradictory study results.
Perhaps the studies utilized different study designs, different statistical methodologies, different survey techniques, different confounding variables, different clinical endpoints, or different populations. Perhaps the physiological effects of coffee are modulated by the dynamic interplay of a complex array of biomechanisms that are differently triggered in each individual based on their unique, dynamic phenotype-genotype profiles.
Or perhaps...just perhaps...there's something even more fundamental at play. The proverbial elephant in the room of any statistical analysis. The essential, pivotal question upon which all your results rest...
"What am I measuring? And how well am I actually measuring what I think I'm measuring?"
Measurement system analysis helps ensure that your study isn't doomed from the start.
A measurement systems analysis (MSA) evaluates the consistency and accuracy of a measuring system. MSA helps you determine whether you can trust your data before you use a statistical analysis to identify trends and patterns, test hypotheses, or make other general inferences.
MSA is frequently used for quality control in the manufacturing industry. In that context, the measuring system typically includes the data collection procedures, the tools and equipment used to measure (the "gage"), and the operators who measure.
Coffee consumption studies don't employ a conventional measuring system. Often, they rely on self-reported data from people who answer questionnaires about their life-style habits, such as "How many cups of coffee do you drink in a typical day?" So the measuring "system," loosely speaking, is every respondent who estimates the number of cups they drink. Despite this, could MSA uncover potential issues with measurements collected from such a survey?
Caveat: What follows is an exploratory exercise performed with small set of nonrandom data for illustrative purposes only. To see standard MSA scenarios and examples, including sample data sets, go to the Minitab's online dataset library and select the category Measurement systems analysis.
 Gage Linearity and Bias: "Houston, we have a problem..."
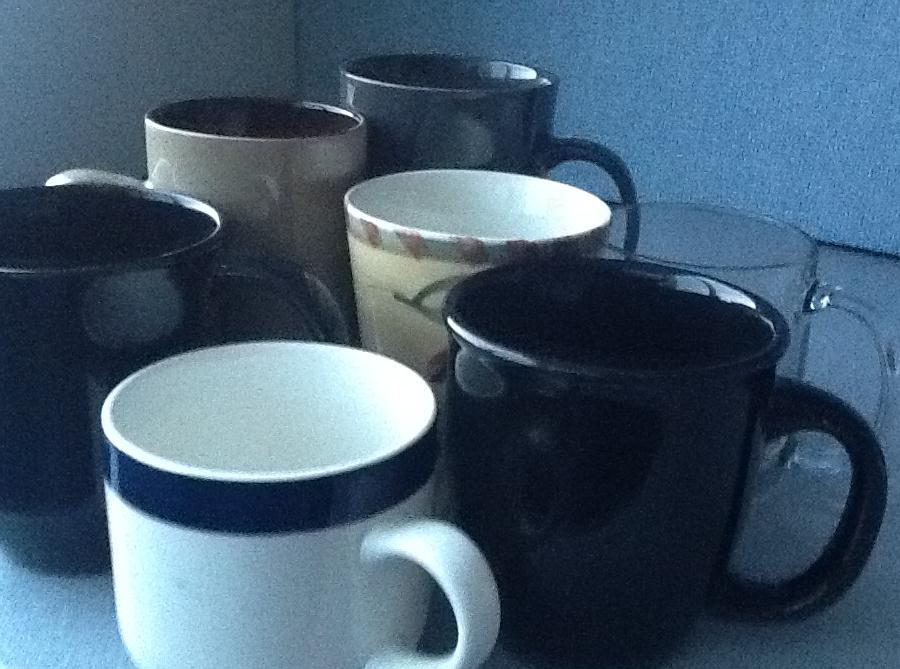
For this experiment (I can't call it a study), I collected different coffee cups in the cupboard of our department lunchroom (see image at right). Then I poured different amounts of liquid into each cup and and asked people to tell me how full the cup was. The actual amount of liquid was 0.50 cup, 0.75 cup, or 1 cup, as measured using a standard measuring cup.
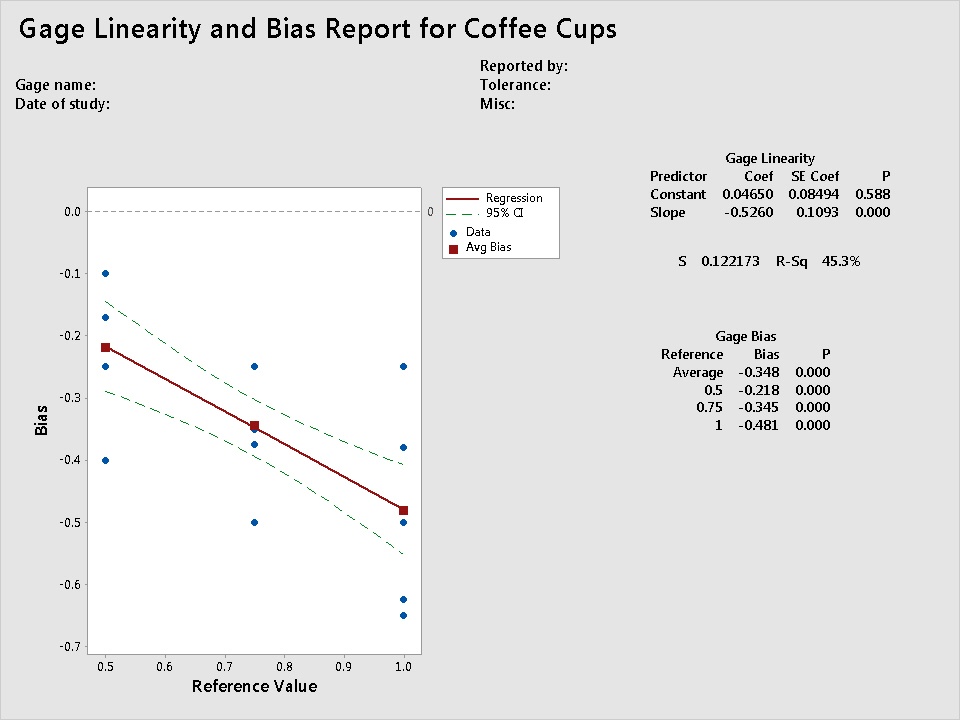
To evaluate the estimated "measurements" in relation to the actual reference values, I performed a gage linearity and bias study (Stat > Quality Tools > Gage Study > Gage Linearity and Bias Study). The results are shown below.

Note: A gage linearity and bias study evaluates whether a measurement system has bias when compared to a known standard. It also assesses linearity—the difference in average bias through the expected operating range of the measuring device. For this example, I didn't enter an estimate of process variation, so the results don't include linearity estimates.
The Y axis shows the amount of bias, which is the difference between the observed measurement using the gage and the reference or master value. For this study, bias is the difference between the reported volume measured using different coffee cups minus the actual measured volume using a standard cup. If the measurements perfectly match the reference values, the data points on the graph should fall along the line bias = 0, with a slope of 0.
That's obviously not the case here. The estimated measurements for all three reference values show considerable negative bias. That is, when using the coffee cups in our department lunchroom as "gages", every person's estimated measurement was much smaller than the actual amount of liquid. Not a surprise, because the coffee cups are larger than a standard cup. (There are coffee cups that hold about one standard cup, by the way, such as the cup that I use every morning. But most Americans don't drink from coffee cups this small. It was designed back in the '50s, when most things—houses, grocery carts, cheeseburgers—were made in more modest proportions).
The Gage Bias table shows that the average bias increases as the amount of liquid increases. And even though this was a small sample, the bias was statistically significant (P < 0.000). Importantly, notice that the bias wasn't consistent at each reference value—there is a considerable range of bias among the estimates at each reference value.
Despite its obvious limitations, this informal, exploratory analysis provides some grounds for speculation.
What does "one cup of coffee" actually mean in studies that use self-reported data? What about categories such as 1-2 cups, or 2-4 cups? If it's not clear what x cups of coffee actually refers to, what do we make of risk estimates that are specifically associated with x number of cups of coffee? Or meta-analyses that combine self-reported coffee consumption data from different countries (equating one Japanese "cup of coffee", say, with one Australian "cup of coffee"?)
Of course, perfect data sets don't exist. And it's possible that some studies may manage to identify valid overall trends and correlations associated with increasing/decreasing coffee consumption.
Still, let's just say that a self-reported "cup of coffee" might best be served not with cream and sugar, but with a large grain of salt.
So before you start brewing your data...
And before you rush off to calculate p-values...it's worth taking the extra time and effort to make sure that you're actually measuring what you think you're measuring.


