


The Centers for Medicare and Medicaid Services (CMS) updated their star ratings on July 27. Turns out, the list of hospitals provide a great way to look at how easy it is to get random samples from data within Minitab.
Say for example, that you wanted to look at the association between the government’s new star ratings and the safety rating scores provided by hospitalsafetyscore.org . The CMS score is about overall quality, which includes components that aren't explicitly about safety, such as the quality of the communication between patients and doctors.The safety score judges patient safety, using components like how often patients begin antibiotics before surgery and whether the process by which doctors order medications is reliable.
The CMS score gives out 1 to 5 stars. The safety score gives out A through F grades. The two measures aren't supposed to be duplicates, but it would be interesting to know whether there's an association between being a safer hospital and being a higher-quality hospital.
The government, kindly, provides the ability to download all 4,788 rows of data in their star ratings, but hospitalsafetyscore.org prefers to provide information by location so that potential patients can quickly examine hospitals near them or find a particular hospital. To compare the star ratings and the safety scores, we need both values.
One solution would be to search hospitalsafetyscore.org for the names of all 4,788 hospitals in the government’s database and record all the scores we found. (Though even if we did this, we wouldn't find all of them. For example, hospitals in Maryland aren't required to provide the data hospitalsafetyscore.org uses.) However, searching 4,788 hospitals is time-consuming.
A faster solution is to study the relationship using a sample of the data. We’ll use the government’s star score data as our sampling frame.
A simple random sample
It’s easy to get a simple random sample in Minitab. If you already have the government's star data in Minitab, you can try this (or, you can skip getting it from the government and use this Minitab worksheet version I created):
- Choose Calc > Random Data > Sample From Columns.
- In Number of Rows to Sample, enter 50.
- In From columns, enter c1-c29. That lets you get all of the information from a row of data into your new sample.
- In store sample in, enter c30-c58. Click OK.
- Copy the column headers from the original data to the sample data.
Now, you have a sample of 50 hospitals chosen where each row in the original data set was equally likely.
A stratified sample
Of course, every simple random sample that you draw might not give you something representative, especially if your sample is small. For example, in the government’s star rating, only 2.82% of hospitals achieved 5 stars (102 hospitals). Even worse, nearly 25% of the hospitals in the data don't have a star rating (1,171 hospitals with no star rating).
If we do a hypergeometric probability calculation on a sample of size 50, assuming 102 events in a population of 3617, we find that roughly 25% of the random samples we could take would have 0 hospitals that achieved 5 stars. A simple random sample without any 5-star hospitals could tell us about the general association, but wouldn’t give us much information about what expected safety ratings for hospitals that achieved 5-star rank.
One way to fix the problem would be to take a larger simple random sample. If you take a sample of size 100 instead of a sample of size 50, then the probability that you don’t get any 5-star hospitals is almost down to 5%. Another method would be to modify your sampling scheme to make sure that you got some of every hospital ranking into your sample. Usually, you break your sample down into different groups, or strata. Then you take a simple random sample from each strata. At the end, you combine your multiple simple random samples to form your final sample.
The exact way that you determine how many observations to take from each strata depends on your goals, but let’s say that for this case, we’re going to get 10 hospitals for each star rating. We start by dividing the data:
- Choose Data > Split Worksheet.
- In By variables, enter ‘Hospital overall rating’. Click OK.
Now, we have separate worksheets with the hospitals that achieved each number of stars. We repeat the simple random-sampling process on each worksheet so that we have a sample of 10 from each ranking.
Now we want to combine those samples from the different star rating data.
- Choose Data > Stack Worksheets.
- Move the worksheets with the star rating data from Available Worksheets to Worksheets to stack.
- Name the new worksheet and click OK.
If you’d like the worksheet to be just your final sample, you can go one step further.
- Choose Data > Copy > Columns to Columns.
- In Copy from Columns, enter c29-c58.
- Name the new worksheet.
- Click Subset the data.
- Select Rows that match and click Condition.
- In Condition, enter c42 <>’*’. Click OK in all 3 dialog boxes.
Now you have a worksheet with 50 hospitals, 10 for each star rating.
Hospital Data
At hospitalsafetyscore.org, I was able to find safety ratings for 30 of the hospitals in my sample of hospitals with government star ratings. I have a little bit of concern because I was more likely to find safety ratings on hospitals with lower star ratings than with higher star ratings, but I did find at least 4 hospitals in each category. Because I'm interested in the relationship between the scores and not in the evaluating individual hospitals, I can proceed with my smaller sample size to see if I can get a rough idea about the relationship.
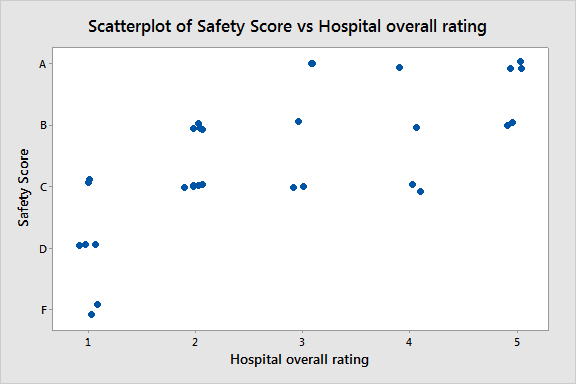
My sample data suggest a relationship between the safety score and the star rating from the government. If we treat the variables as ordinal, the Spearman's rho that measures their correlation is about 0.73 and significantly different from 0. We would not expect perfect agreement because the two ratings are intended to measure different constructs. Still, in the stratified sample, we can see that no 1-star hospital achieved a safety score better than a C and that no 5-star hospital had a safety rating less than a B.
Ready for more on Minitab? Read about the role Minitab played om helping Akron Children's Hospital could reduce costs while improving patient care.