by Matthew Barsalou, guest blogger
Recently Minitab’s Joel Smith posted a blog about an incident in which he was pooped on by a bird. Twice. I suspect many people would assume the odds of it happening twice are very low, so they would incorrectly assume they are safer after such a rare event happens.
I don’t have data on how often birds poop on one person, and I assume Joel is unwilling to stand under a flock of berry-fed birds waiting to collect data for me, so I’ll simply make up some numbers for illustration purposes only.
Suppose there is a 5% chance of being pooped on by a bird during a vacation. That means the probability of being pooped on is 0.05. The probability of being pooped on twice during the vacation is 0.0025 (0.05 x 0.05) or 0.25%, and the probability of being pooped on three times is 0.000125 (0.05. x 0.05 x 0.05).
Joel has already been pooped on twice. So what is the probability of our intrepid statistician being pooped on a third time?
The probability is 0.05. If you said 0.000125, then you may have made a mistake known as the Gambler’s Fallacy or the Monte Carlo Fallacy. This fallacy is named after the mistaken belief that things will average out in the short-term. A gambler who has suffered repeated losses may incorrectly assume that the recent losses mean a win is due soon. Things will balance out in the long term, but the odds do not reset after each event. Joel could correctly conclude the probability of a bird pooping on him during his vacation are low and the odds of being pooped on twice are much lower. But being pooped on one time does not affect the probability of it happening a second time.
There is a caveat here. The probabilities only apply if the meeting of poop and Joel are random events. Perhaps birds, for reasons understood only by birds, have an inordinate fondness for Joel. Our probability calculations would no longer apply in such a situation. This would be like calculating the probabilities of a coin toss when there is some characteristic that causes the coin to land more on one side than on the other.
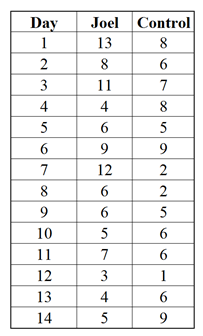
We can perform an experiment to determine if Joel is just a victim of the odds or if there is something that makes the birds target him. The generally low occurrence rate would make it difficult to collect data in a reasonable amount of time so we should perform an experiment to collect data. We could send Joel to a bird sanctuary for two weeks and record the number of times he is pooped on. Somebody of approximately the same size and appearance as Joel could be used as a control. Both Joel and the control should be dressed the same to ensure that birds are not targeting a particular color or clothing brand. The table below shows the hypothetical results of our little experiment.

We can see that Joel was hit 99 times, while the control was only hit 80 times. But does this difference mean anything? To find out, we can use Minitab Statistical Software to determine if there is a statistically significant difference between the number of times Joel was hit and the number of times the control was hit.
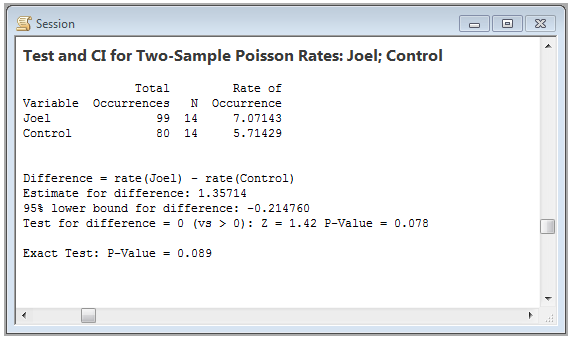
Enter the data into Minitab and then go to Stat > Basic Statistics > 2-Sample Poisson Rate and select “Each sample is in its own column.” Go to Options and select “Difference > hypothesized difference” as the alternative hypothesis for a one-tailed upper tailed test. The resulting P-value shown in the output below is 0.078. That's greater than the alpha of 0.05 so we fail to reject the null hypothesis. Although there was a higher occurrence rate for Joel, we have no reason to think that birds are especially attracted to him.

Joel is well aware of the Gambler’s Fallacy, so we can be assured that he is not under a false sense of security. He must know the probability of him getting struck a third time has not changed. But has he considered that these may not be random events? The experiment described here was only hypothetical. Perhaps Joel should consider wearing a sou’wester and rain coat the next time he takes a vacation in the sun.
About the Guest Blogger
Matthew Barsalou is a statistical problem resolution Master Black Belt at BorgWarner Turbo Systems Engineering GmbH. He is a Smarter Solutions certified Lean Six Sigma Master Black Belt, ASQ-certified Six Sigma Black Belt, quality engineer, and quality technician, and a TÜV-certified quality manager, quality management representative, and auditor. He has a bachelor of science in industrial sciences, a master of liberal studies with emphasis in international business, and has a master of science in business administration and engineering from the Wilhelm Büchner Hochschule in Darmstadt, Germany. He is author of the books Root Cause Analysis: A Step-By-Step Guide to Using the Right Tool at the Right Time, Statistics for Six Sigma Black Belts and The ASQ Pocket Guide to Statistics for Six Sigma Black Belts.


