by Matthew Barsalou, guest blogger
In my last post, I shared my plans for building a simple do-it-yourself catapult for performing experiments to practice using design of experiments (DOE).
That's the completed catapult there on the right. If you want to build your own, here are my plans and instructions in a PDF.
Now that my catapult is built, I have one last step to complete: to find the optimal catapult setting using DOE, which I'll do with Minitab Statistical Software. (If you'd like to follow along but don't already have it, please download the 30-day free trial of Minitab.)
Planning the Designed Experiment: Possible Factors and Levels
The catapult has 6 factors with three possible levels each. The factors are:
- rubber band guide
- arm stopper
- starting point
- rubber band
- rubber band attachment on arm
- projectile
The rubber band guide increases the distance the rubber band must travel and thereby stretches the rubber band. The rubber band guide can be set at one of three possible heights by moving the metal rod to the screw eye at the required height. The levels are the distance from the top of the base of the catapult to the center of the screw eye for the guide.
The arm stopper stops the catapults arm after lunch and the factors are the distance from the beginning of the support connector to the center of the screw eye for the stopper.
The starting point is the lowest point at which the catapult arm can be pushed down to prior to launching the projectile. The levels are the distances from the top of the base to the middle of the screw eyes used for the starting points.
The rubber band factors are the diameters of the rubber bands, and the projectile factors are the weight of the bags of rice used as a projectile. The final factor is the point where the rubber band is attached to the catapult arm; the three levels are the distances from the end of the arm to the attachment point.
The table below shows the factors and their possible levels:
| Factor |
First level |
Second level |
Third level |
| Rubber band guide |
4 cm |
9 cm |
14 cm |
| Arm stopper |
5 cm |
10 cm |
15 cm |
| Starting point |
3 cm |
8 cm |
13 cm |
| Rubber band |
90 mm |
100 mm |
130 mm |
| Projectile |
25 g |
37.5 g |
50 g |
| Attachment on arm |
14 cm |
18 cm |
22 cm |
Additional levels are possible. There is enough room on the catapult to add more levels to the rubber band guide, arm stopper and starting point. There are also more rubber band sizes available and the weight of the projectiles is not infinite, but limited only by the upper limit of what the catapult can throw. For most DOE trials six factors with three levels should be sufficient. This results in 36 possible combinations. That means 729 combinations. Adding an extra level to each factor would result in 4,096 combinations and a fifth level would result in 15,625 combinations. Doubling the number of levels to six would result in 46,656 different combinations.
The catapult may be large enough to accommodate six levels for each of the six possible factors; however, DOE would be needed to find the optimal settings without running all possible combinations.
The DOE Experiment
I had to put the catapult to use after finishing with the assembly. The first experiment performed using the catapult was a 23 full factorial with three replicates. This means that three factors were evaluated, each at two levels, and each treatment was run three times. The factors are levels for the experiment were:
| Projectile |
Rubber band |
Starting point |
| 10 g |
90 mm |
3 cm |
| 10 g |
90 mm |
13 cm |
| 10 g |
130 mm |
3 cm |
| 10 g |
130 mm |
13 cm |
| 20 g |
90 mm |
3 cm |
| 20 g |
90 mm |
13 cm |
| 20 g |
130 mm |
3 cm |
| 20 g |
130 mm |
13 cm |
Each run was performed at a high and low value for the factors. The high value is designated by “(2)” and the low value is designated by “(1)” in my Minitab data sheet. The run order was determined at random to ensure randomization. This was essential to ensure that the results were indeed the results of the factors and levels evaluated, and not changes in the system as the testing progressed. For example, the rubber bands used may stretch during testing. Randomization helps to ensure the test results of such uncontrollable factors are spread across the test result, and Minitab Statistical Software's DOE tools provide a randomized run order by default.
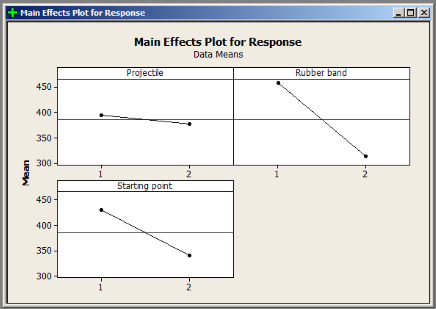
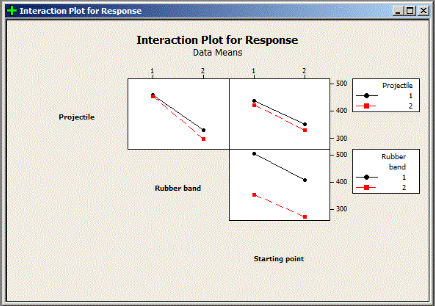
I performed the runs in the order determined by the software and recorded the results. Next, I used Minitab to generate a main effects plot and an interaction plot for the response variable, distance traveled by the projectile.


The results indicate that the interactions were not significant. However, the analysis results shown in the main effects plot indicate a large difference between the high and low settings for both rubber band and starting point. This makes sense, since the smaller rubber band should provide more force than the larger rubber band. The lower starting point for the catapult arm results in a greater distance of travel between the release point of the arm and the stopping point where the arm releases the projectile.
The effect of the projectile weight was not as important as the other factors. This may be due to the very light weight of the projectiles. The higher setting was twice the weight of the low setting; however, the lower setting was only the equivalent of approximately 4 quarters. Maybe a difference of a dollar’s worth of quarters is too little to result in a larger main effect for distance traveled? This could also be investigated using the catapult and Minitab...


