


by Dan Wolfe, guest blogger
How would you measure a hole that was allowed to vary one tenth the size of a human hair? What if the warmth from holding the part in your hand could take the measurement from good to bad? These are the types of problems that must be dealt with when measuring at the micron level.
As a Six Sigma professional, that was the challenge I was given when Tenneco entered into high-precision manufacturing. In Six Sigma projects “gage studies” and “Measurement System Analysis (MSA)” are used to make sure measurements are reliable and repeatable. It’s tough to imagine doing that type of analysis without statistical software like Minitab.
We have an active and established Six Sigma community as part of the “Tenneco Global Process Excellence” program, and Minitab is an integral part of training and project work at Tenneco.
Verifying Measurement Systems
Verifying the measurement systems we use in precision manufacturing and assembly is just one instance of how we use Minitab to make data-driven decisions and drive continuous improvement.
Even the smallest of features need to meet specifications. Tolerance ranges on the order of 10 to 20 microns require special processes not only for manufacturing, but also measurement. You can imagine how quickly the level of complexity grows when you consider the fact that we work with multiple suppliers from multiple countries for multiple components.
To gain agreement between suppliers and Tenneco plants on the measurement value of a part, we developed a process to work through the verification of high precision, high accuracy measurement systems such as CMM and vision.
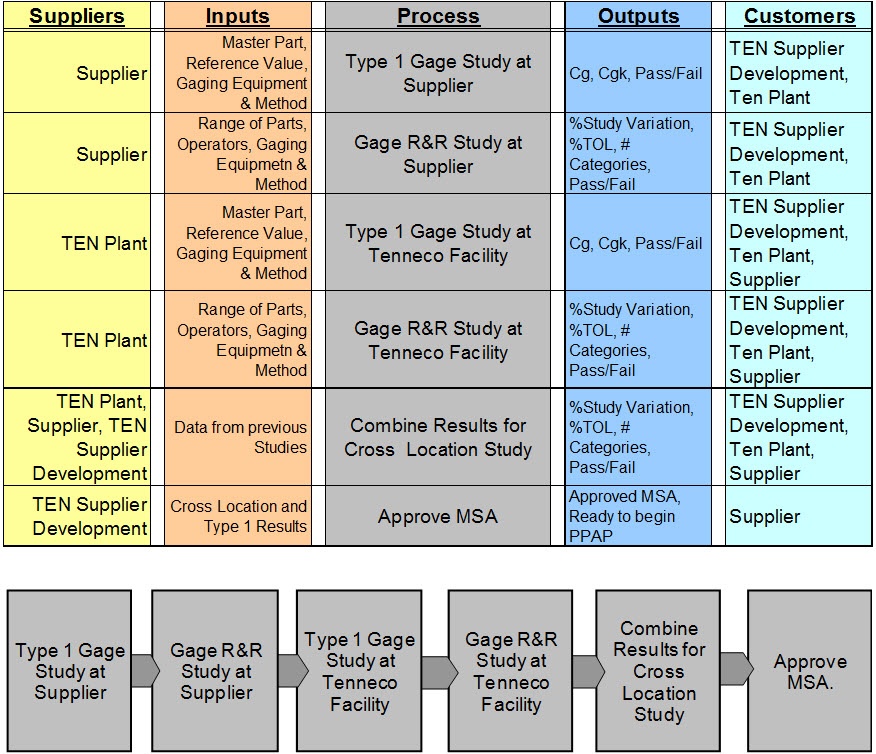
The following SIPOC (Supplier, Input, Process, Output, Customer) process map shows the basic flow of the gage correlation process for new technology.
What If a Gage Study Fails?
If any of the gage studies fail to be approved, we launch a problem-solving process. For example, in many cases, the Type 1 results do not agree at the two locations. But given these very small tolerance ranges, seemingly small differences can have significant practical impact on the measurement value. One difference was resolved when the ambient temperature in a CMM lab was found to be out of the expected range. Another occurred when the lens types of two vision systems were not the same.
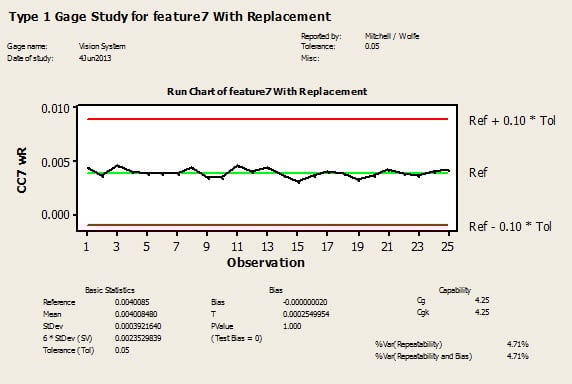
Below is an example of a series of Type 1 gage studies performed to diagnose a repeatability issue on a vision system. It shows the effect of part replacement (taking the part out of the measurement device, then setting it up again) before each measurement and the bias created by handling the part.
For this study, we took the results of 25 measurements made when simply letting the part sit in the machine and compared them with 25 measurements made when taking the part out and setting it up again between each of 25 measurements. The analysis shows picking the part up, handling it and resetting it in the machine changes the measurement value. This was found to be statistically significant, but not practically significant. Knowing the results of this study helps our process and design engineers understand how to interpret the values given to them by the measurement labs, and give some perspective on the considerations of the part and measurement processes.
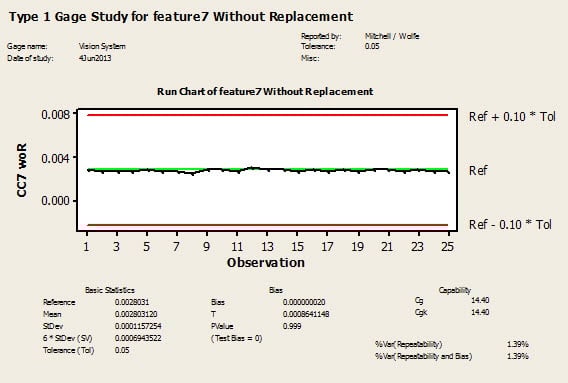
The two graphs below show Type 1 studies done with versus without replacement of the part. There is a bias between the two studies. A test for equal variance shows a difference in variance between the two methods.
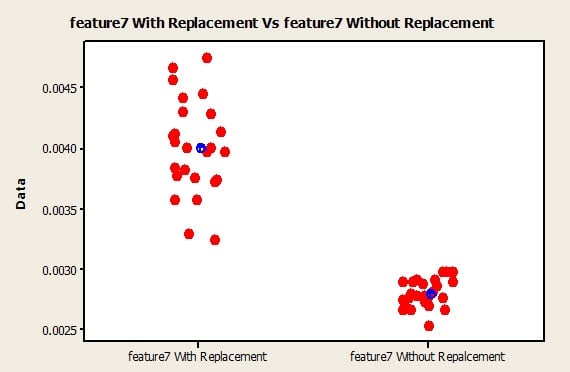
As the scatterplot below illustrates, the study done WITH REPLACEMENT has higher standard deviation. It is statistically significant, but still practically acceptable.
Minitab’s gage study features are a critical part of the gage correlation process we have developed. Minitab has been integrated into Tenneco’s Six Sigma program since it began in 2000.
The powerful analysis and convenient graphing tools are being used daily by our Six Sigma resources for these types of gage studies, problem-solving efforts, quality projects, and many other uses at Tenneco.
About the Guest Blogger:
Dan Wolfe is a Certified Lean Six Sigma Master Belt at Tenneco. He has led projects in Engineering, Supply Chain, Manufacturing and Business Processes. In 2006 he was awarded the Tenneco CEO award for Six Sigma. As a Master Black Belt he has led training waves, projects and the development of business process design tools since 2007. Dan holds a BSME from The Ohio State University and an MSME from Oakland University and a degree from the Chrysler Institute of Engineering for Automotive Engineering.