


by Matthew Barsalou, guest blogger
At the end of the first part of this story, a group of evil trouble-making chickens had convinced all of their fellow chickens to march on the walled city of Wetzlar, where, said the evil chickens, they all would be much happier than they were on the farm.
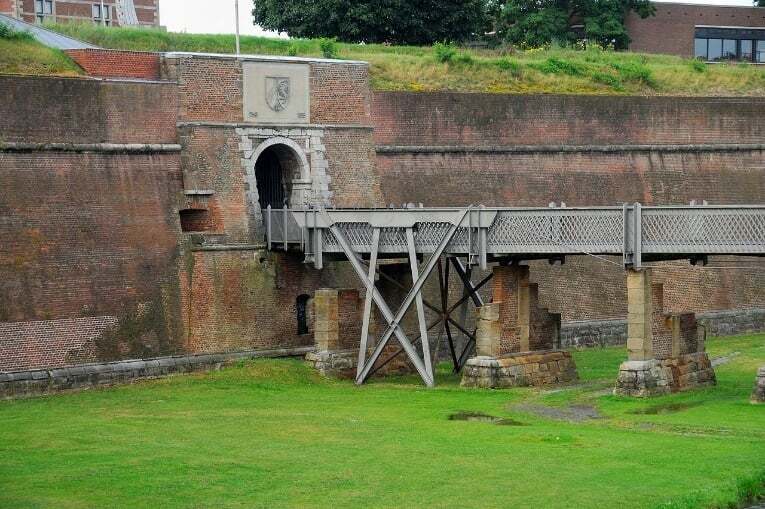
The chickens marched through the night and arrived at Wetzlar on the Lahn as the sun came up. “Let us in!” demanded the chickens.
|
By Krusto - self made by Krusto, CC BY 2.0 de, https://commons.wikimedia.org/w/index.php?curid=1712222 |
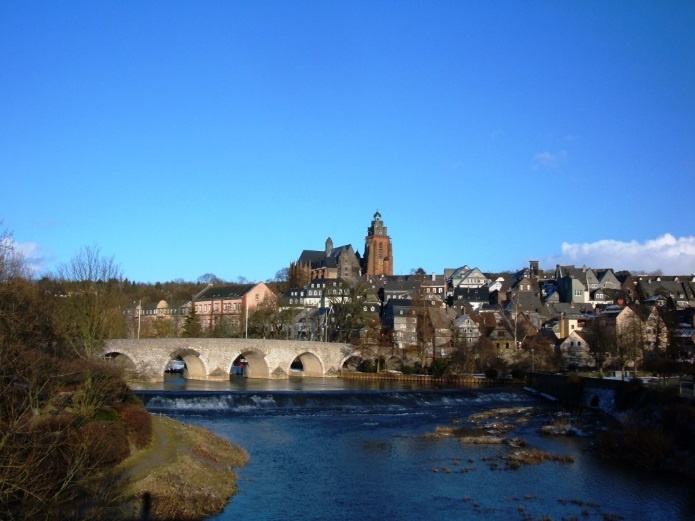
"No," said the Swan of the Lahn, the ruler of Wetzlar.
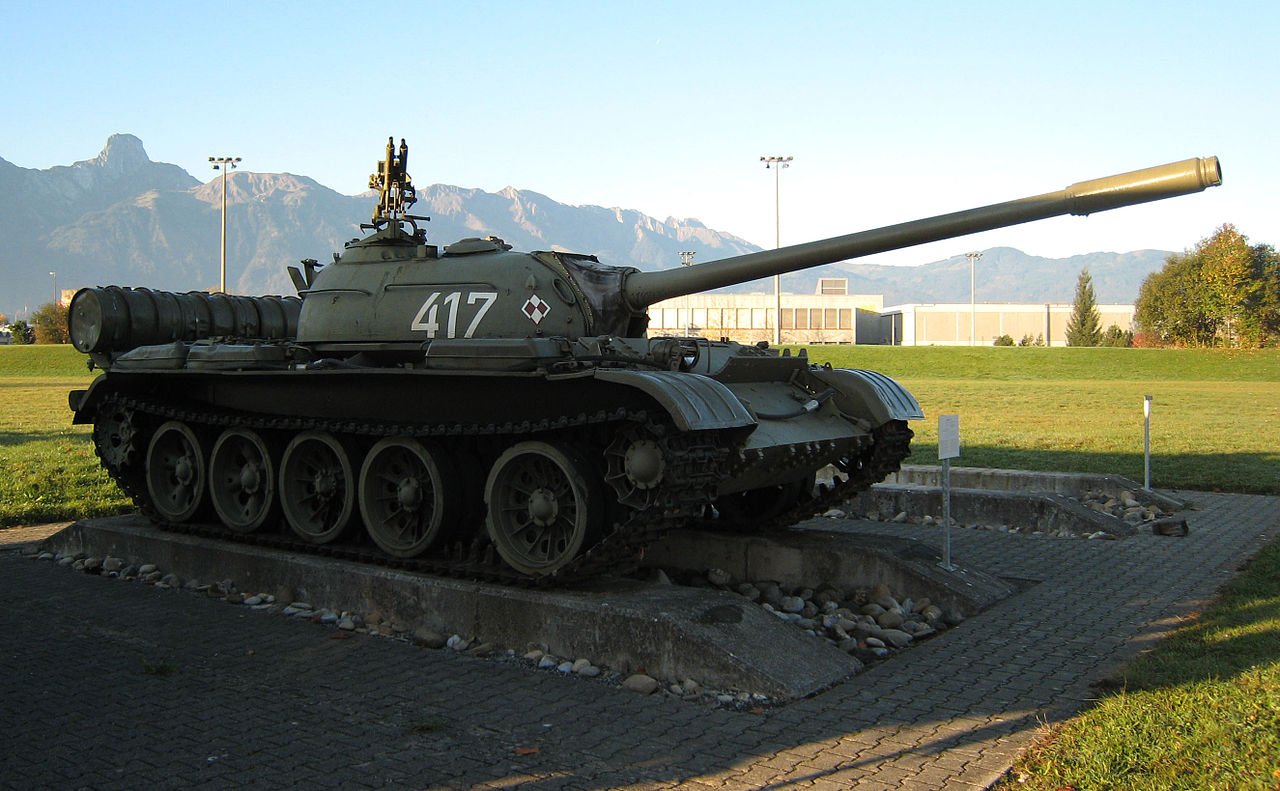
The chickens spent the day trying to force open the gates of Wetzlar. One chicken snuck off to meet with a goose known for dealing in antiques such as lamps, chairs, and main battle tanks. The chicken returned by early evening driving a slightly used T-55 tank.
|
By Sandstein - Own work, CC BY 3.0, https://commons.wikimedia.org/w/index.php?curid=5069466 |
Sid, the undercover duck who'd infiltrated the flock to spy on the evil chickens for the Swan of the Lahn, realized he needed to do something, and fast. So he looked up the amount of fuel used for the distance driven for 47 T-55s, then performed a regression analysis to determine how far this one could go if it had full fuel tanks.
To recreate Sid's analysis in Minitab, download his data set (and the trial version of Minitab 18, if you need it) and go to Stat > Regression > Fit Regression Model..., and select Distance as the Response and Fuel as the Continuous predictor. Then click on Graphs and select Four in one.
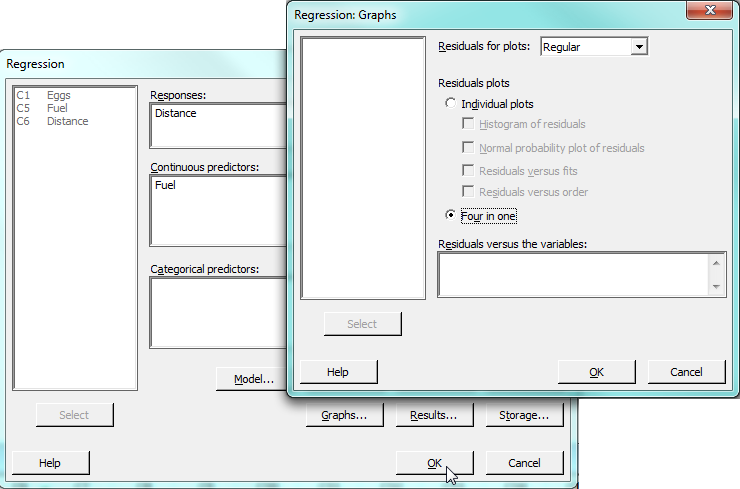
Click OK twice, and Minitab produces the following output:
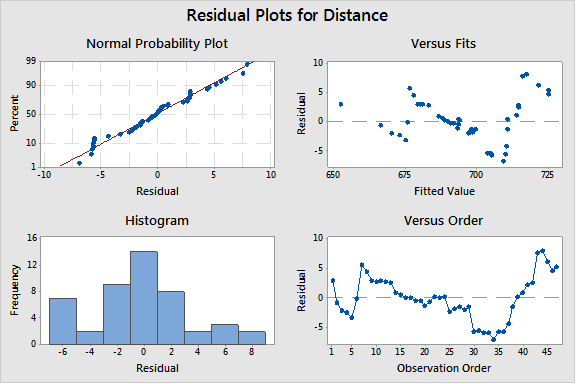
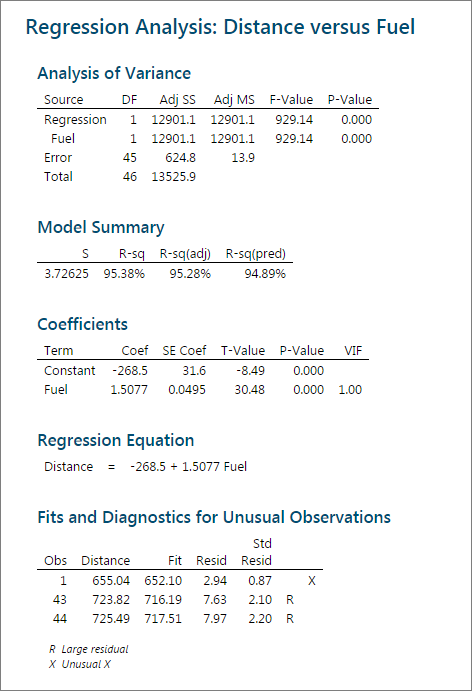
We can see that there is a statistically significant relationship between fuel used and distance traveled. The R-squared statistics indicates the amount of fuel used explains 95.28% of the variability in distance traveled. There seems to be something odd with the order of the data, as seen in the Four in One graph. The Session window output shows three unusual values, two of which have large residuals. This is an indication that these data are not perfect for a regression analysis.
However, better data would not matter in this case, since Sid the Duck once again investigated the wrong question. Predicting how far the tank could travel was irrelevant, given it had already arrived at the town. The real question Sid should have asked was, “Can a T-55 round penetrate the gates of Wetzlar?”
|
By Peter Haas /, CC BY-SA 3.0, https://commons.wikimedia.org/w/index.php?curid=28496059 |
The chicken inside the tank huffed and puffed and fired the main gun directly at the gates of Wetzlar, but the round simply bounced off. He fired again and again, but the rounds just bounced off again and again. Eventually, the T-55 broke down—as they are known to do—so the chickens gathered in force and attempted to knock the gates down by running into them.
But a gate that can survive a tank’s main gun round will not budge when rammed by chickens, no matter how determined they are.
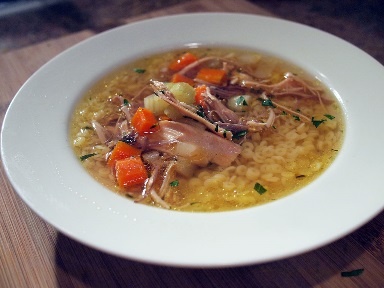
The Swan of Wetzlar had had enough by this time, so boiling chicken soup with noodles and vegetables was poured onto the chickens. This was too much for the chickens, so they fled.
|
Chicken Noodle Soup by Hoyabird8 at English Wikipedia |
Unfortunately, the road they had followed had washed out in the heavy rains so the only route home was through the Bird Mountains...the terribly misnamed Bird Mountains, which could more accurately be called the Hungry Foxes Everywhere Mountains.
|
Von Pulv - Eigenes Werk, CC BY-SA 3.0, https://commons.wikimedia.org/w/index.php?curid=15979924 |

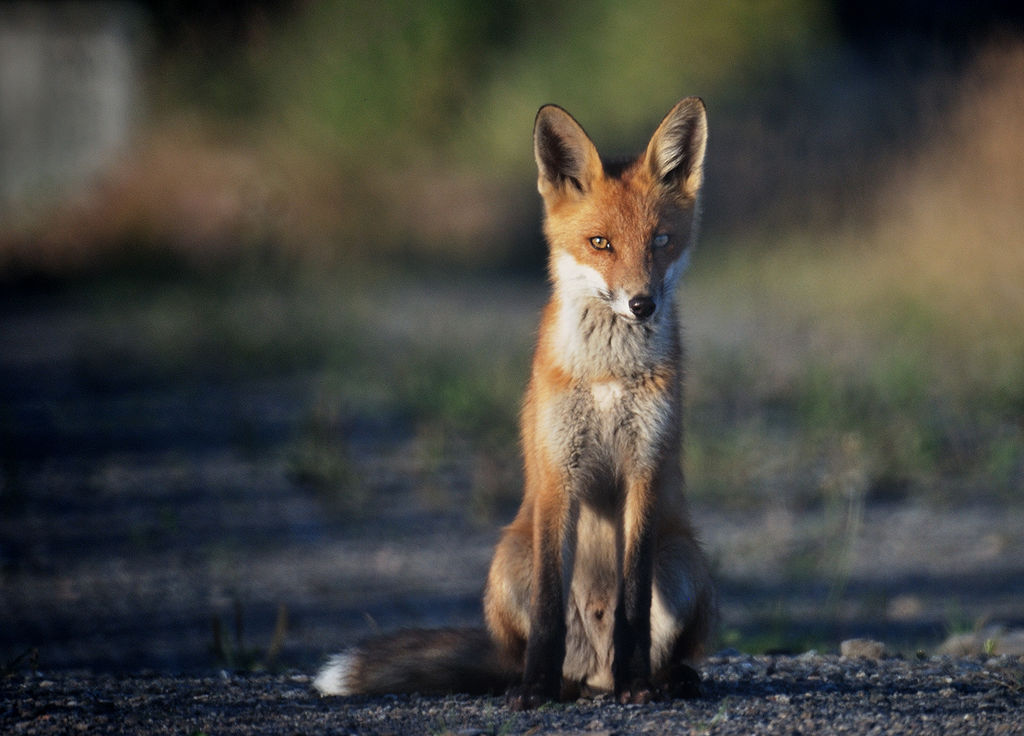
The chickens fled into the forests of the Bird Mountains. Knowing the dangers of these forests, the evil chickens let the other chickens lead so that they would encounter the foxes first. However, the evil chickens failed to consider that foxes are, as they say, sly as foxes. The foxes of the woefully misnamed Bird Mountains waited till the chickens were well into their territory, and then fell upon those in the rear—the evil chickens.
Evil chickens nonetheless taste like chicken, and the foxes feasted.
|
By Foto: Jonn Leffmann, CC BY 3.0, https://commons.wikimedia.org/w/index.php?curid=21536441 |
Upon returning with the flock to the farm, Sid suspected the evil chickens had been decimated, so he did a survey. Originally, 647 out of the population of 1,541 chickens were evil, so he randomly sampled 175 chickens and found only 22 of these chickens were evil. Sid wanted to know if the new proportion of evil chickens was less than the older portion, so so he did a one-tailed two proportion test.
To do this in Minitab, go to Stat > Basic Statistics > 2 Proportions... and select Summarized data in the drop down menu. Enter 22 for the number of events and 175 for the number of trials under Sample 1 and enter 647 for the number of events and 1,541 for the number of trials under Sample 2. Click on options and select Difference < hypothesized difference...
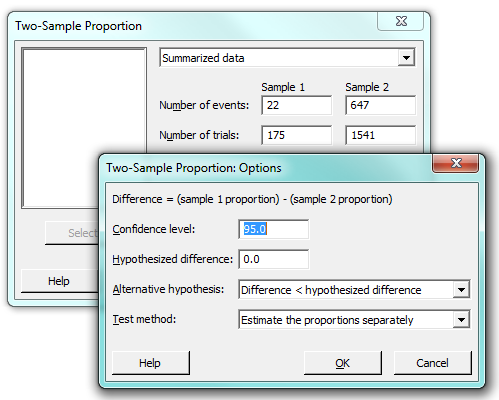
Then click OK twice.
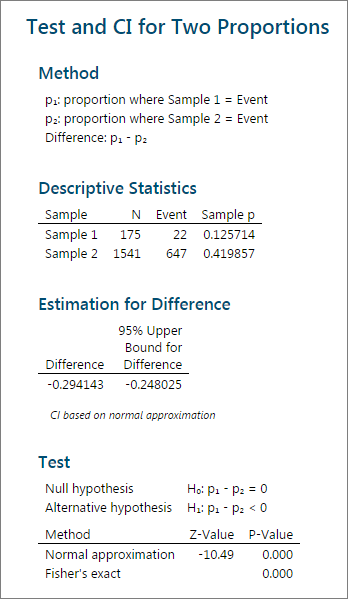
The resulting p-value is less than 0.05, so Sid can conclude there is a statically significant difference between the samples.
After returning home, the chickens were confused. Just days earlier all had been well, and suddenly they had found themselves in such an adventure. The remaining evil chickens weren't confused, since they had instigated it all. But, they were understandably upset with how things and ended and they began to argue and blame each other for the failure. Both recriminations and feathers flew.
Evil chickens started turning each other into the farmer which resulted in a weight gain for the farmer and an even greater reduction in the proportion of evil chickens in the flock. Sid surreptitiously arranged a few “accidents” to dispatch the remaining evil chickens.
The pigs eventually forgave the innocent chickens for the egg-throwing incident, and the remaining chickens lived happily ever after. The cow spent the rest of her life hoping for another dinner of eggs.
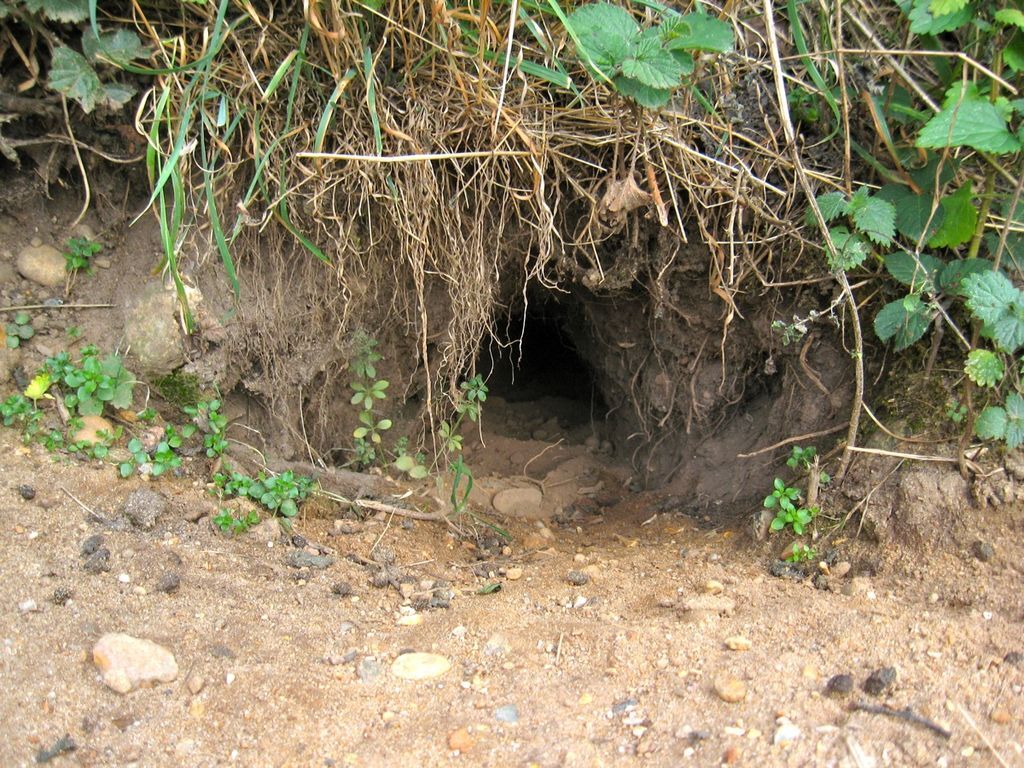
As for Sid, his next assignment was the infiltration of a rabbit den. How a duck disguised himself as a rabbit is a tale for another time.
|
By Brammers - Own work, Public Domain, https://commons.wikimedia.org/w/index.php?curid=7862100 |
There is a moral to this story: If you need help with statistics, call a statistician...not a duck.
About the Guest Blogger
Matthew Barsalou is a statistical problem resolution Master Black Belt at BorgWarner Turbo Systems Engineering GmbH. He is a Smarter Solutions certified Lean Six Sigma Master Black Belt, ASQ-certified Six Sigma Black Belt, quality engineer, and quality technician, and a TÜV-certified quality manager, quality management representative, and auditor. He has a bachelor of science in industrial sciences, a master of liberal studies with emphasis in international business, and has a master of science in business administration and engineering from the Wilhelm Büchner Hochschule in Darmstadt, Germany. He is author of the books Root Cause Analysis: A Step-By-Step Guide to Using the Right Tool at the Right Time, Statistics for Six Sigma Black Belts and The ASQ Pocket Guide to Statistics for Six Sigma Black Belts.