


by Matthew Barsalou, guest blogger
The great Dr. Seuss tells of Mr. Plunger, who is the custodian at Diffendoofer School on the corner of Dinkzoober and Dinzott in the town of Dinkerville. The good Mr. Plunger “keeps the whole school clean” using a supper-zooper-flooper-do.
Unfortunately, Dr. Seuss fails to tell us where the supper-zooper-flooper-do came from and if the production process was capable.
Let’s assume the broom boom length was the most critical dimension on the supper-zooper-flooper-do. The broom boom length drawing calls for a length of 55.0 mm with a tolerance of +/- 0.5 mm. The quality engineer has checked three supper-zooper-flooper-do broom booms and all were in specification, so he concludes that there is no reason to worry about the process producing out of specification parts. But we know this not true. Perhaps the fourth supper-zooper-flooper-do broom boom will be out of specification. Or maybe the 1,000th.
It’s time for a capability study, but don’t fire up your Minitab Statistical Software just yet. First we need to plan the capability study. Each day the supper-zooper-flooper-do factory produces supper-zooper-flooper-do broom booms with a change in broom boom material batch every 50th part. A capability study should have a minimum of 100 values and 25 subgroups. The subgroups should be rational: that means the variability within each subgroup should be less than the variability between subgroups. We can anticipate more variation between material batches than within a material batch so we will use the batches as subgroups, with a sample size of four.
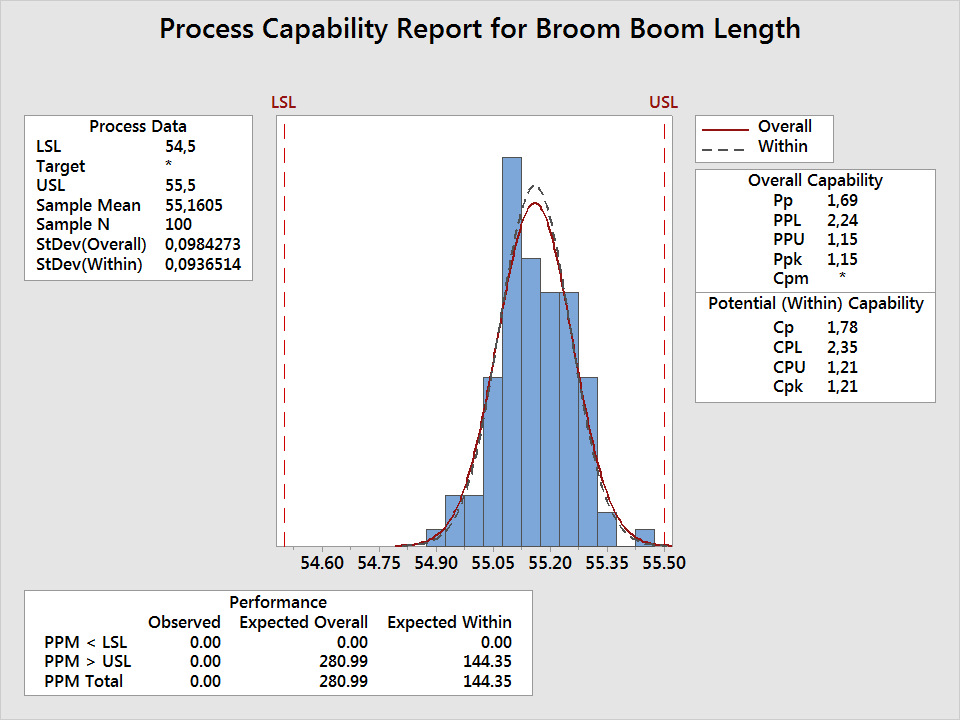
Once the data has been collected, we can crank up our Minitab and perform a capability study by going to Stat > Quality Tools > Capability Analysis > Normal. Enter the column containing the measurement values. Then either enter the column containing the subgroup or type the size of the subgroup. Enter the lower specification limit and the upper specification limit, and click OK.
We now have the results for the supper-zooper-flooper-do broom boom lengths, but can we trust our results? A capability study has requirements that must be met. We should have a minimum of 100 values and 25 subgroups, which we have. But the data should also be normally distributed and in a state of statistical control; otherwise, we either need to transform the data, or identify the distribution of the data and perform capability study for nonnormal data.
Dr. Seuss has never discussed transforming data so perhaps we should be hesitant if the data do not fit a distribution. Before performing a transformation, we should determine if there is a reason the data do not fit any distribution.
We can use the Minitab Capability Sixpack to determine if the data is normally distributed and in a state of statistical control. Go to Stat > Quality Tools > Capability Sixpack > Normal. Enter the column containing the measurement values. Then either enter the column containing the subgroup or type the size of the subgroup. Enter the lower specification limit and the upper specification limit and click OK.
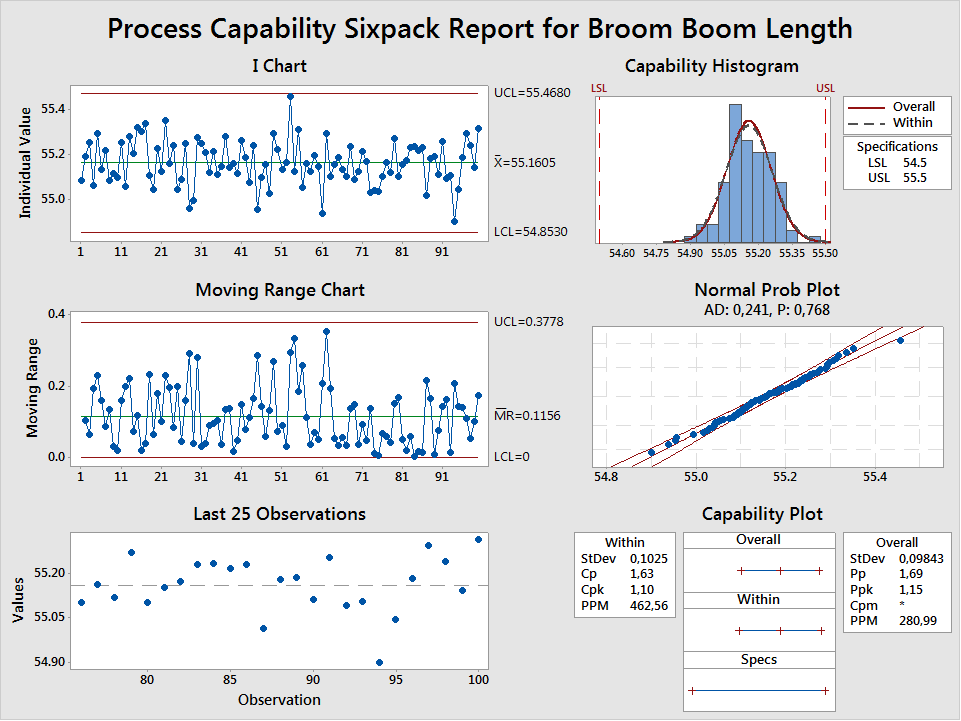
There are no out-of-control points in the control chart and the normal probability plot follows a straight line, and has a P value is greater than 0.05, so we fail to reject the null hypothesis that the data follow a normal distribution. The data is suitable for a capability study.
The within subgroup variation is also known as short term capability and is indicated by Cp and Cpk. The between subgroup variability is also known as long term capability is given as Pp and Ppk. The Cp and Cpk fail to account for the variability that will occur between batches; Pp and Ppk tell us what we can expect from the process over time.
Both Cp and Pp tell us how well the process conforms to the specification limits. In this case, a Cp of 1.63 tells us the spread of the data is much narrower than the width of the specification limits, and that is a good thing. But Cp and Pp alone are not sufficient. The Cpk and Ppk indicate how spread out the data is relative to the center of the specification limits. There is an upper and lower Cpk and Ppk; however, we are generally only concerned with the lower of the two values.
In the supper-zooper-flooper-do broom boom length example, a Cpk of 1.10 is an indication that the process is off center. The Cp is 1.63, so we can reduce the number of potentially out-of-specification supper-zooper-flooper-do broom booms if we shift the process mean down to center the process while maintaining the current variation. This is a fortunate situation as it is often easier to shift the process mean than to reduce the process variation.
Once improvements are implemented and verified, we can be sure that the next supper-zooper-flooper-do the Diffendoofer School purchases for Mr. Plunger will have a broom boom that is in specification if only common cause variation is present.
About the Guest Blogger
Matthew Barsalou is a statistical problem resolution Master Black Belt at BorgWarner Turbo Systems Engineering GmbH. He is a Smarter Solutions certified Lean Six Sigma Master Black Belt, ASQ-certified Six Sigma Black Belt, quality engineer, and quality technician, and a TÜV-certified quality manager, quality management representative, and auditor. He has a bachelor of science in industrial sciences, a master of liberal studies with emphasis in international business, and has a master of science in business administration and engineering from the Wilhelm Büchner Hochschule in Darmstadt, Germany. He is author of the books Root Cause Analysis: A Step-By-Step Guide to Using the Right Tool at the Right Time, Statistics for Six Sigma Black Belts and The ASQ Pocket Guide to Statistics for Six Sigma Black Belts.