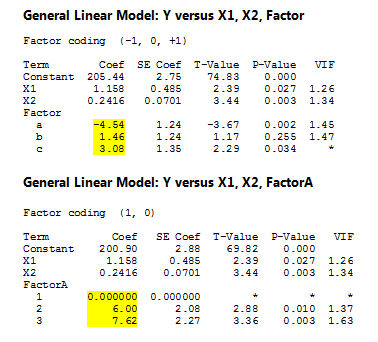
In my previous post, I showed you that the coefficients are different when choosing (-1,0,1) vs (1,0) coding schemes for General Linear Model (or Regression).
We used the two different equations to calculate the same fitted values. Here I will focus on showing what the different coefficients represent.
Let's use the data and models from the last blog post:

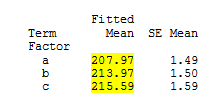
We can display the means for each level by choosing Stat > ANOVA > General Linear Model > Fit General Linear Model > Options. These means are called fitted means, or least squares means. Note that when the design is not balanced, the fitted means will differ from the data means.

And we could calculate the overall mean using Stat > Basic Statistics > Display Descriptive Stats:

Using the (-1,0,1) coding scheme, the coefficients represent the difference between each level mean and the overall mean.
Using the (1,0) coding scheme, the coefficients represent the difference between each level mean and the baseline level’s mean.
(-1,0,1) Coding
| Coeff = Mean for level – Overall Mean |
|
| Coeffa = Mean for a – Overall Mean |
-4.54 = 207.97 - 212.51 |
| Coeffb = Mean for b – Overall Mean |
1.46 = 213.97 - 212.51 |
| Coeffc = Mean for c – Overall Mean |
3.08 = 215.59 - 212.51 |
(1,0) Coding
| Coeff = Mean for level – Mean for baseline level |
|
| Coeffa = Mean for a – Mean for a |
0.0 = 207.97 - 207.97 |
| Coeffb = Mean for b –Mean for a |
6.0 = 213.97 - 207.97 |
| Coeffc = Mean for c –Mean for a |
7.62 = 215.59 - 209.97 |
After reading this two-part blog, I hope you see that you could get the same results when running General Linear Model and Regression on the same data set.
When changing the coding scheme you can still expect the results to match, except for the coefficients and single equations. Although the coefficients are different, you'll get the same fitted values. And finally, I hope you see what the coefficients mean for each coding scheme.
And remember, if you're using Minitab Statistical Software to analyze your data, our technical support team is always ready to help you!


