All measurements are rounded to some degree. In most cases, you would not want to reject normality just because the data are rounded. In fact, the normal distribution would be a quite desirable model for the data if the underlying distribution is normal since it would smooth out the discreteness in the rounded measurements.
Some normality tests reject a very high percentage of time due to rounding when the underlying distribution is normal (Anderson-Darling and Kolmogorov-Smirnov), while others seem to ignore the rounding (Ryan-Joiner and chi square).
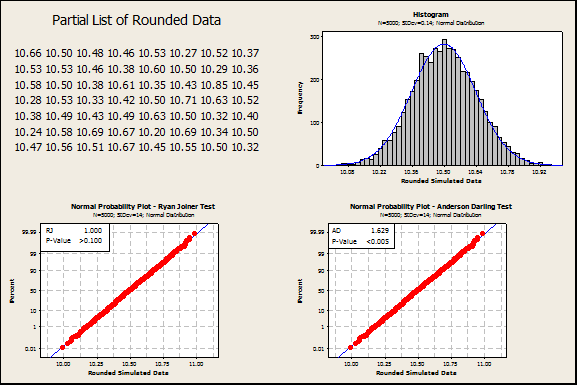
As an extreme example of how data that is very well modeled by a normal distribution can get rejected, consider a sample size of 5000 from a normal distribution with mean 10 and standard deviation of 0.14.
The display below shows a partial list of the data rounded to the nearest 100th, a histogram, and probability plots of that same data. The histogram and probability plots look great. The Ryan-Joiner Test passes Normality with a p-value above 0.10 (probability plot on the left). However, the Anderson-Darling p-value is below 0.005 (probability plot on the right). Clearly, rejecting Normality in a case like this is inappropriate.
A simulation was conducted to address a more common sample size, n=30. Data were simulated from a normal distribution with mean 0 and standard deviation 1, then rounded to the nearest integer. An example of a probability plot from this simulation appears below.
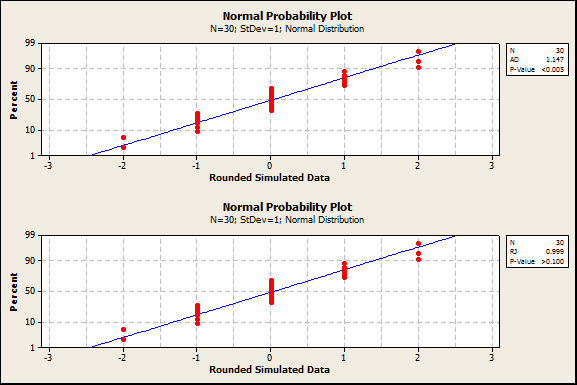
In this iteration of the simulation, the Anderson-Darling P-value was less than 0.005 while the Ryan-Joiner P-value was greater than 0.10.
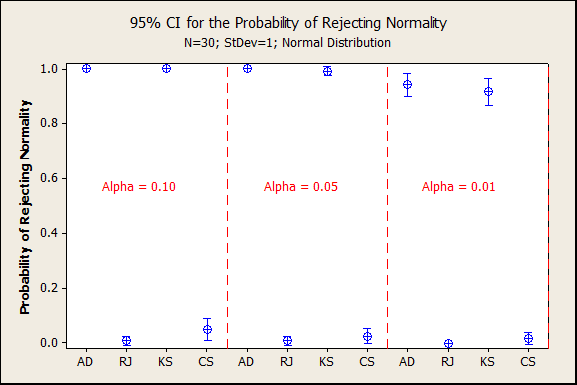
The simulation results were remarkably consistent, with the Anderson-Darling (AD) test almost always rejecting normality and the Ryan-Joiner (RJ) test almost always failing to reject normality. The Kolmogorov-Smirnov (KS) and Chi-square (CS) tests were included in the simulation too. The CS test was almost as good as the RJ test at avoiding rejecting normality due to rounding.
A second simulation was conducted with less extreme rounding*. Data were simulated from a normal distribution with mean 0 and standard deviation 2, then rounded to the nearest integer. An example of a probability plot from this simulation is below. In this iteration of the simulation, the Anderson-Darling P-value was less than 0.05 while the Ryan-Joiner P-value was greater than 0.10.
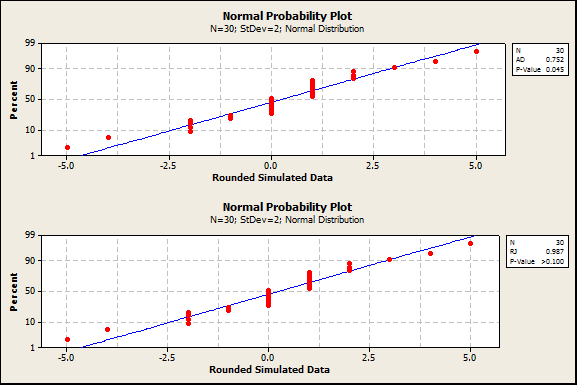
In this second simulation with less extreme rounding, the AD and KS tests did not reject as often.
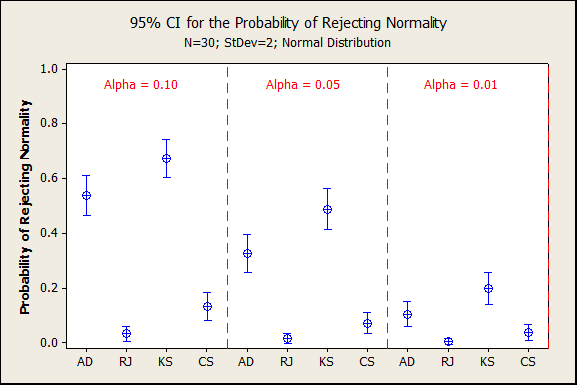
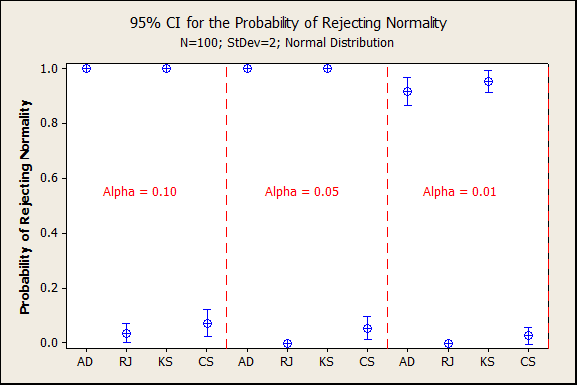
A third simulation was conducted with the same degree of rounding as the second simulation, but a larger sample size, n=100. Due to the larger sample size, the AD and KS tests went back to almost always rejecting normality. The RJ and CS tests again almost never rejected normality due to rounding.
So far, we have only discussed avoiding rejecting normality due to rounding, but do the RJ and CS tests detect when there is truly a non-normal distribution? A final simulation was conducted with the same degree of rounding as the first simulation, but from an underlying non-normal distribution. Data were simulated from an exponential distribution with standard deviation 1, then rounded to the nearest integer. The AD and KS tests correctly rejected normality, but likely due to rounding as much as non-normality. The RJ and CS tests did detect the non-normality, just not as often as the AD and KS tests.
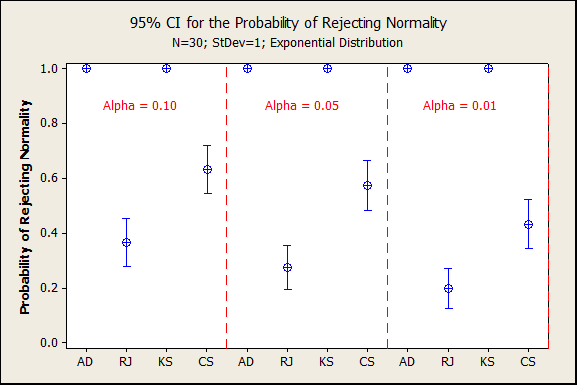
In summary, the RJ and CS tests avoid rejecting Normality just due to rounding (simulations 1-3) while still detecting data that truly comes from a non-normal distribution (simulation 4).
*The degree of rounding in this post is defined as (Measurement Resolution) / (Standard Deviation), where measurement resolution is the smallest change a measuring system can detect. The larger this ratio, the more extreme the rounding.


