


Minitab's LinkedIn group is a good place to ask questions and get input from people with experience analyzing data and doing statistics in a wide array of professions. For example, one member asked this question:
I am trying to create a chart that can monitor change by month. I have [last year's] data and want to compare it to [this year's] data...what chart should I use, and can I auto-update it? Thank you.
As usual when a question is asked, the Minitab user community responded with some great information and helpful suggestions. Participants frequently go above and beyond, answering not just the question being asked, but raising issues that the question implies. For instance, one of our regular commenters responded thus:
There are two ways to answer this inquiry...by showing you a solution to the specific question you asked or by applying statistical thinking arguments such as described by Donald Wheeler et al and applying a solution that gives the most instructive interpretation to the data.
In this and subsequent posts, I'd like to take a closer look at the various suggestions group members made, because each has merits. First up: a simple individuals chart of differences, with some cool tricks for instant updating as new data becomes available.
Individuals Chart of Differences
An easy way to monitor change month-by-month is to use an individuals chart. Here's how to do it in Minitab Statistical Software, and if you'd like to play along, here's the data set I'm using. If you don't already have Minitab, download the free 30-day trial version.
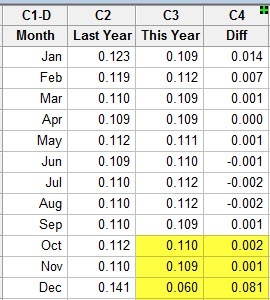
I need four columns in the data sheet: month name, this year's data, last year's data, and one for the difference between this year and last. I'm going to right-click on the Diff column, and then select Formulas > Assign Formula to Column..., which gives me the dialog box below. I'll complete it with a simple subtraction formula, but depending on your situation a different formula might be called for:
With this formula assigned, as I enter the data for this year and last year, the difference between them will be calculated on the fly.
Now I can create an Individuals Chart, or I Chart, of the differences. I choose Stat > Control Charts > Variables Charts for Individuals > Individuals... and simply choose the Diff column as my variable. Minitab creates the following graph of the differences between last year's data and this year's data:
Updating the Individuals Chart Automatically
Now, you'll notice that when I started, I only had this year's data through September. What happens when I need to update it for the whole year? Easy - I can return to the data sheet in January to add in the data from the last quarter. As I do, my Diff column uses its assigned formula (indicated by the little green cross in the column header) to calculate the differences:
Now if I look at the I-chart I created earlier, I see a big yellow dot in the top-left corner.
When I right-click on that yellow dot and choose "Automatic Updates," as shown in the image above, Minitab automatically updates my Individuals chart with the information from the final three months of the year:
Whoa! It looks like we might have some special-cause variation happening in that last month of the year...but at least I can use the time I've saved by automatically updating this chart to start investigating that!
In my next post, we'll try another way to look at monthly differences, again following the suggestions offered by the good people on Minitab's LinkedIn group.