


When the ambient temperature in my house reached 400 degrees one afternoon this summer, I realized that—no matter
what the guy who answers the phone at the Weather Channel claimed—it was too possible for a human being to melt. So I broke down and bought an air conditioner. After a few minutes, my skin lost the alarming waxiness it had acquired. I was confident that I'd remain solid for the rest of the summer.
About a week later, though, the air conditioner began to emit a keening, metallic wail. Now, speaking as a guy who owns not one but several
Merzbow albums, a little industrial noise seemed like a small price to pay for keeping my skin temperature safely below the melting point. In fact, after a while, I came to rather enjoy the air conditioner's shrieking siren song.
But the next day when the air conditioner delivered only screeching, and no cool air, it no longer sounded so sweet. As the sun rose higher and the temperature soared, my brain latched onto a single idea:
Warranty Analysis.
Somewhere, I knew, existed data that had predicted the demise of my fan, and quantified just how much it would cost the manufacturer to make good on this product's one-year warranty.
Predicting Warranty Costs Is Good for Business
No manufacturer sets out to disappoint—let alone melt—a customer, but defects can exist so most provide a warranty to keep their customers satisfied. But anticipating warranty costs for a product or business can be challenging, even risky. Setting aside too little money or too many spare parts may lead to hardship if an unanticipated problem arises. Setting aside too much money ties up resources that might be used more effectively elsewhere.
So how can you estimate future warranty expenses with confidence? Very smart people at the company that made my air conditioner had grappled with that very question, and in a flash I realized how they could answer it.
All they needed was a little data! As rivulets of sweat dripped down my brow, I fired up my laptop to try it for myself.
Maybe it was just the heat getting to me, but I had a vision of the number of returns this manufacturer might receive each month for a year's worth of air conditioner production. All they needed to forecast warranty claims in the coming year was the number of fans shipped over the previous 12 months, and the number of each shipment returned each month.
What Data Do I Need to Predict Future Warranty Claims?
When I entered my fever-dream
data into a blank data sheet in Minitab, it looked like this:
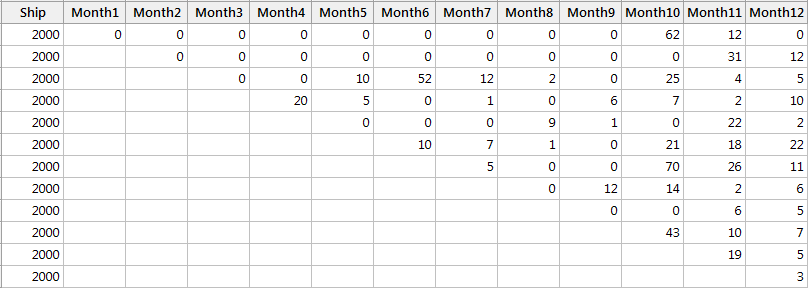
This data was in what's called a
triangular matrix format. Though I could feel myself beginning to get a little pliable in my sweltering living room, I knew I had to convert this matrix into a regular
time-to-failure format in order to run my warranty analysis.
I selected
Stat > Reliability/Survival > Warranty Analysis > Pre-Process Warranty Data in Minitab. For "Shipment (sale) column," I entered
Ship. For "Return (failure) columns," I entered
Month1-Month12. Columns for
Start time,
End time, and
Frequencies appeared as if by magic in my datasheet. Clearly, Minitab was in no way inconvenienced by the heat!
Data Analysis for Warranty Prediction
Now I could proceed with my analysis, as long as I didn't suffer heatstroke before it finished. I chose
Stat > Reliability/Survival > Warranty Analysis > Warranty Prediction. In the dialog box, I entered
Start time in "Start time,"
End time in "End time," and
Frequencies in "Frequency (optional)."
Next I clicked the button that said "Prediction." I entered 12 as the number of periods for which to predict failures. In "Production quantity for each time period," I entered 2000. Then, with what I felt sure would be my final breaths before succumbing, I clicked on OK in each dialog box.
Interpreting the Warranty Prediction Results
Instantly, before I could expire, up popped a graph:
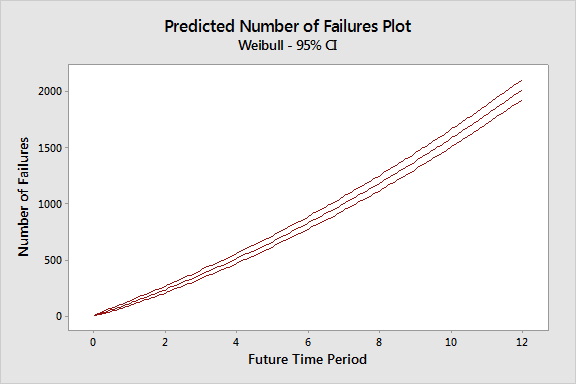
Even through my heat-seared eyes, it was easy to see how this graph outlined the number of air conditioner returns the manufacturer could expect for each month in the coming year.
But Minitab's Session Window had also filled with output. The Summary of Current Warranty table showed that mine was among 635 failed units shipped in the year.
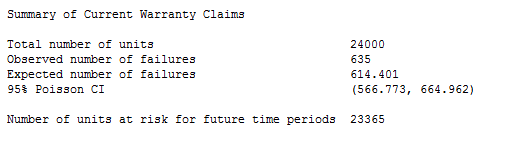
Interesting, but cold comfort in my situation. Next, I looked at the Table of Predicted Number of Failures, which displays information about the potential and predicted number of failures in the upcoming months:
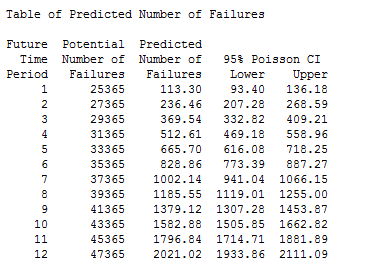
The Potential Number of Failures for each future time period is the number of units at risk at the end of the data collection period, plus the number of additional units that will ship in each subsequent period. The predicted number of failures is the number of failures that the model predicts from the end of the data collection period through the specified number future time periods. And the the 95% Poisson confidence interval provides a range of likely values for the predicted number of failures.
In the table above, 12 months from now, 47,365 fans will be at risk. With 95% confidence, you can expect the number of failures to fall between approximately 1,933 and 2,111. If I were the manufacturer of the air conditioners, I could plan accordingly.
Knowing that the manufacturer expected and probably already planned for the return of my failed unit somehow gave me the strength to fight through the heat and exchange it for another one, per the terms of the company's warranty. And the rest of the summer's been pretty cool around my house.