


Since it's the Halloween season, I want to share how a classic horror film helped me get a handle on an extremely useful statistical distribution.
The film is based on John W. Campbell's classic novella "Who Goes There?", but I first became familiar with it from John Carpenter's 1982 film The Thing .In the film, researchers in the Antarctic encounter a predatory alien with a truly frightening ability: it can assume the form of any living thing it touches. It's a shapeshifter. A mimic with the uncanny ability to take on the characteristics of other beings. Soon, the researchers realize that they can no longer be sure who among them is really human, and who is not.
So what does that have to do with statistics? Meet the Weibull distribution, or, as I like to think of it, "The Thing" of statistical distributions. The Weibull distribution can take on the characteristics of many other distributions. The good news is, unlike The Thing, the Weibull distribution's ability to shapeshift is very helpful.
The Weibull Distribution Can't Be Nailed Down
Because the Weibull distribution can assume the form of many different distributions, it's a favorite among quality practitioners and engineers, and it's by far the most commonly used distribution for modeling reliability data. Just like "The Thing," the Weibull distribution is adaptable enough to be able to pass for other things—in this case, a variety of other distributions.
Got right-skewed, left-skewed, or symmetric data? You can model it with Weibull, no problem. That flexibility lets engineers use the Weibull distribution to evaluate the reliability of everything from ball bearings to vacuum tubes.
The Weibull distribution can also model hazard functions that are decreasing, increasing or staying constant, so it to be used to model any phase of an item’s lifetime, from right after launch to the end of its usefulness.
How "The Thing" the Weibull Curve Changes Shape
To illustrate how flexible the Weibull distribution is, let's look at some examples in Minitab Statistical Software. (Care to follow along, but don't have Minitab? Just download the free 30-day trial.)
Start by choosing Graph > Probability Distribution Plot, which brings up this dialog box:
Select "View Single," and then choose "Weibull" in the Distribution drop-down menu. The subsequent dialog box will let you specify three parameters: shape, scale, and threshold.
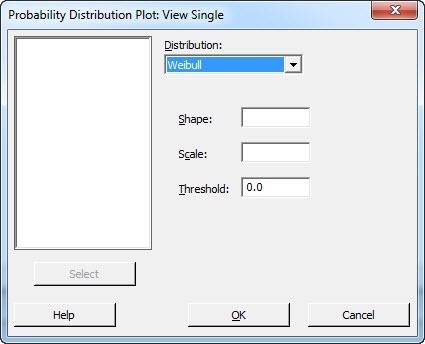
The threshold parameter indicates the distribution's shift away from 0. A negative threshold will shift the distribution to the left of 0, while a positive threshold shifts it to the right. (All data must be greater than the threshold.)
The scale parameter is the 63.2 percentile of the data, and this value defines the Weibull curve's relation to the threshold, in the same way that the mean defines a normal curve's position. For our purposes, let's say we're testing reliability, and that 63.2 percent of the items we test fail within the first 10 hours following the threshold time. So our scale would be 10.
The shape parameter, unsurprisingly enough, describes the Weibull curve's shape. Changing the shape value enables you to use Weibull to model the characteristics of many different life distributions.
Entire books have been written about how these three parameters affect the characteristics of the Weibull distribution, but for this discussion we'll focus on how the value of shape can influence the curve. I'll show these examples one-by-one, but you can have Minitab display them together on a single plot if you select "Vary Parameters" instead of "View Single" in the first dialog box shown above.
Weibull with Shape Less Than 1
Let's start with a shape between 0 and 1. You may choose any value you like in that range. I'm going to enter enter 0.4, and when I press "OK", Minitab gives me the graph below:
The graph shows that probability decreases exponentially from infinity. If you're thinking about reliability, or the rate of failures, the Weibull distribution with these parameters would fit data that have a high number of initial failures. Then the failures decrease over time as the defective items are eliminated from the sample. These early failures are frequently referred to as "infant mortality," because they occur in the early stage of a product's life.
Weibull with Shape = 1
When the shape is equal to 1, the Weibull distribution decreases exponentially from 1/alpha, where alpha = the scale parameter. In other words, the failure rate remains fairly consistent over time. This Weibull distribution's shape is applicable to data about random failures and multiple-cause failures, and can be used to model the useful life of products.
Weibull with Shape Between 1 and 2
When the shape parameter is between 1 and 2, Weibull crests quickly, then decreases more gradually. The most rapid failure rate occurs initially. This shape indicates failures due to early wear-out.
Weibull with Shape = 2
When the shape parameter is equal to 2, Weibull approximates a linearly increasing failure rate, where the risk of wear-out failure increases steadily over the product's lifetime. (This variant of the Weibull distribution is also referred to as the Rayleigh distribution.)
Weibull with Shape Between 3 and 4
When the shape parameter falls between 3 and 4, Weibull becomes symmetric and bell-shaped, like the normal curve. For reliability, this form of the distribution suggests rapid wear-out failures during the final period of product life, when most failures happen.
Weibull with Shape > 10
When the shape is more than 10, the Weibull distribution is similar to an extreme value distribution. This form of the distribution can approximate the final stage of a product's life.
Will "The Thing" Weibull Always Win?
When it comes to analyzing reliability, Weibull is the de facto default distribution, but other distribution families also can model a variety of distributional shapes. You want to find the distribution that gives you the very best fit for your data, and that may not be a Weibull. For instance, the lognormal distribution is typically used to model failures caused by chemical reactions or corrosion.
To assess the fit of your data using Minitab’s Distribution ID plot, you can use Stat > Reliability/Survival > Distribution Analysis (Right-Censoring or Arbitrary Censoring). If you want more details about that, check out this post on identifying your data's distribution.