


"Data! Data! Data! I can't make bricks without clay."
— Sherlock Holmes, in Arthur Conan Doyle's The Adventure of the Copper Beeches
Whether you're the world's greatest detective trying to crack a case or a person trying to solve a problem at work, you're going to need information. Facts. Data, as Sherlock Holmes says.
But not all data is created equal, especially if you plan to analyze as part of a quality improvement project.
If you're using Minitab Statistical Software, you can access the Assistant to guide you through your analysis step-by-step, and help identify the type of data you have.
But it's still important to have at least a basic understanding of the different types of data, and the kinds of questions you can use them to answer.
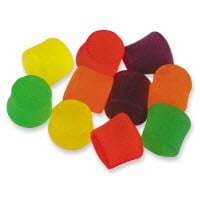
In this post, I'll provide a basic overview of the types of data you're likely to encounter, and we'll use a box of my favorite candy—Jujubes—to illustrate how we can gather these different kinds of data, and what types of analysis we might use it for.
The Two Main Flavors of Data: Qualitative and Quantitative
At the highest level, two kinds of data exist: quantitative and qualitative.
Quantitative data deals with numbers and things you can measure objectively: dimensions such as height, width, and length. Temperature and humidity. Prices. Area and volume.
Qualitative data deals with characteristics and descriptors that can't be easily measured, but can be observed subjectively—such as smells, tastes, textures, attractiveness, and color.
Broadly speaking, when you measure something and give it a number value, you create quantitative data. When you classify or judge something, you create qualitative data. So far, so good. But this is just the highest level of data: there are also different types of quantitative and qualitative data.
Quantitative Flavors: Continuous Data and Discrete Data
There are two types of quantitative data, which is also referred to as numeric data: continuous and discrete. As a general rule, counts are discrete and measurements are continuous.
Discrete data is a count that can't be made more precise. Typically it involves integers. For instance, the number of children (or adults, or pets) in your family is discrete data, because you are counting whole, indivisible entities: you can't have 2.5 kids, or 1.3 pets.
Continuous data, on the other hand, could be divided and reduced to finer and finer levels. For example, you can measure the height of your kids at progressively more precise scales—meters, centimeters, millimeters, and beyond—so height is continuous data.
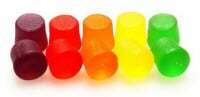
If I tally the number of individual Jujubes in a box, that number is a piece of discrete data.
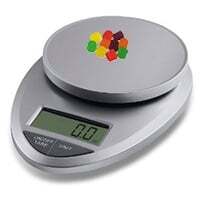
If I use a scale to measure the weight of each Jujube, or the weight of the entire box, that's continuous data.
Continuous data can be used in many different kinds of hypothesis tests. For example, to assess the accuracy of the weight printed on the Jujubes box, we could measure 30 boxes and perform a 1-sample t-test.
Some analyses use continuous and discrete quantitative data at the same time. For instance, we could perform a regression analysis to see if the weight of Jujube boxes (continuous data) is correlated with the number of Jujubes inside (discrete data).
Qualitative Flavors: Binomial Data, Nominal Data, and Ordinal Data
When you classify or categorize something, you create Qualitative or attribute data. There are three main kinds of qualitative data.
Binary data place things in one of two mutually exclusive categories: right/wrong, true/false, or accept/reject.
Occasionally, I'll get a box of Jujubes that contains a couple of individual pieces that are either too hard or too dry. If I went through the box and classified each piece as "Good" or "Bad," that would be binary data. I could use this kind of data to develop a statistical model to predict how frequently I can expect to get a bad Jujube.
When collecting unordered or nominal data, we assign individual items to named categories that do not have an implicit or natural value or rank. If I went through a box of Jujubes and recorded the color of each in my worksheet, that would be nominal data.
This kind of data can be used in many different ways—for instance, I could use chi-square analysis to see if there are statistically significant differences in the amounts of each color in a box.
We also can have ordered or ordinal data, in which items are assigned to categories that do have some kind of implicit or natural order, such as "Short, Medium, or Tall." Another example is a survey question that asks us to rate an item on a 1 to 10 scale, with 10 being the best. This implies that 10 is better than 9, which is better than 8, and so on.
The uses for ordered data is a matter of some debate among statisticians. Everyone agrees its appropriate for creating bar charts, but beyond that the answer to the question "What should I do with my ordinal data?" is "It depends." Here's a post from another blog that offers an excellent summary of the considerations involved.
Ready to try Minitab for yourself? Download a Free Trial!

Additional Resources about Data and Distributions
For more fun statistics you can do with candy, check out this article (PDF format): Statistical Concepts: What M&M's Can Teach Us.
For a deeper exploration of the probability distributions that apply to different types of data, check out my colleague Jim Frost's posts about understanding and using discrete distributions and how to identify the distribution of your data.
See how your company can learn to effectively utilize data to make smarter decisions. Learn more about our Training Services today!