


R-squared gets all of the attention when it comes to determining how well a linear model fits the data. However, I've stated previously that R-squared is overrated. Is there a different goodness-of-fit statistic that can be more helpful? You bet!
Today, I’ll highlight a sorely underappreciated regression statistic: S, or the standard error of the regression. S provides important information that R-squared does not.
What is the Standard Error of the Regression (S)?
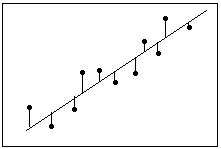 S becomes smaller when the data points are closer to the line.
In the regression output for Minitab statistical software, you can find S in the Summary of Model section, right next to R-squared. Both statistics provide an overall measure of how well the model fits the data. S is known both as the standard error of the regression and as the standard error of the estimate.
S represents the average distance that the observed values fall from the regression line. Conveniently, it tells you how wrong the regression model is on average using the units of the response variable. Smaller values are better because it indicates that the observations are closer to the fitted line.
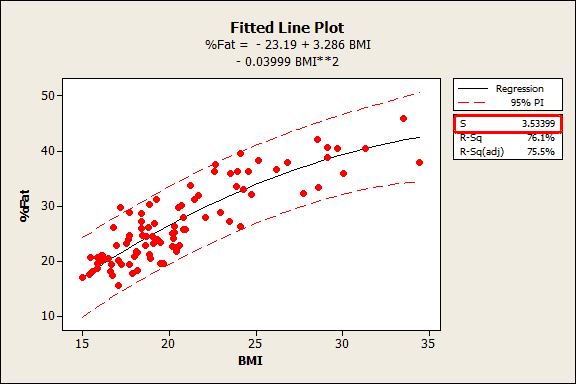
The fitted line plot shown above is from my post where I use BMI to predict body fat percentage. S is 3.53399, which tells us that the average distance of the data points from the fitted line is about 3.5% body fat.
Unlike R-squared, you can use the standard error of the regression to assess the precision of the predictions. Approximately 95% of the observations should fall within plus/minus 2*standard error of the regression from the regression line, which is also a quick approximation of a 95% prediction interval.
For the BMI example, about 95% of the observations should fall within plus/minus 7% of the fitted line, which is a close match for the prediction interval.
Why I Like the Standard Error of the Regression (S)
In many cases, I prefer the standard error of the regression over R-squared. I love the practical, intuitiveness of using the natural units of the response variable. And, if I need precise predictions, I can quickly check S to assess the precision.
Conversely, the unit-less R-squared doesn’t provide an intuitive feel for how close the predicted values are to the observed values. Further, as I detailed here, R-squared is relevant mainly when you need precise predictions. However, you can’t use R-squared to assess the precision, which ultimately leaves it unhelpful.
To illustrate this, let’s go back to the BMI example. The regression model produces an R-squared of 76.1% and S is 3.53399% body fat. Suppose our requirement is that the predictions must be within +/- 5% of the actual value.
Is the R-squared high enough to achieve this level of precision? There’s no way of knowing. However, S must be <= 2.5 to produce a sufficiently narrow 95% prediction interval. At a glance, we can see that our model needs to be more precise. Thanks S!
Read more about how to obtain and use prediction intervals as well as my regression tutorial.