In Parts 1 and 2 of Gauging Gage we looked at the numbers of parts, operators, and replicates used in a Gage R&R Study and how accurately we could estimate %Contribution based on the choice for each. In doing so, I hoped to provide you with valuable and interesting information, but mostly I hoped to make you like me. I mean like me so much that if I told you that you were doing something flat-out wrong and had been for years and probably screwed somethings up, you would hear me out and hopefully just revert back to being indifferent towards me.
For the third (and maybe final) installment, I want to talk about something that drives me crazy. It really gets under my skin. I see it all of the time, maybe more often than not. You might even do it. If you do, I'm going to try to convince you that you are very, very wrong. If you're an instructor, you may even have to contact past students with groveling apologies and admit you steered them wrong. And that's the best-case scenario. Maybe instead of admitting error, you will post scathing comments on this post insisting I am wrong and maybe even insulting me despite the evidence I provide here that I am, in fact, right.
Let me ask you a question:
When you choose parts to use in a Gage R&R Study, how do you choose them?
If your answer to that question required anymore than a few words - and it can be done in one word—then I'm afraid you may have been making a very popular but very bad decision. If you're in that group, I bet you're already reciting your rebuttal in your head now, without even hearing what I have to say. You've had this argument before, haven't you? Consider whether your response was some variation on the following popular schemes:
- Sample parts at regular intervals across the range of measurements typically seen
- Sample parts at regular intervals across the process tolerance (lower spec to upper spec)
- Sample randomly but pull a part from outside of either spec
#1 is wrong. #2 is wrong. #3 is wrong.
You see, the statistics you use to qualify your measurement system are all reported relative to the part-to-part variation and all of the schemes I just listed do not accurately estimate your true part-to-part variation. The answer to the question that would have provided the most reasonable estimate?
"Randomly."
But enough with the small talk—this is a statistics blog, so let's see what the statistics say.
In Part 1 I described a simulated Gage R&R experiment, which I will repeat here using the standard design of 10 parts, 3 operators, and 2 replicates. The difference is that in only one set of 1,000 simulations will I randomly pull parts, and we'll consider that our baseline. The other schemes I will simulate are as follows:
- An "exact" sampling - while not practical in real life, this pulls parts corresponding to the 5th, 15th, 25, ..., and 95th percentiles of the underlying normal distribution and forms a (nearly) "exact" normal distribution as a means of seeing how much the randomness of sampling affects our estimates.
- Parts are selected uniformly (at equal intervals) across a typical range of parts seen in production (from the 5th to the 95th percentile).
- Parts are selected uniformly (at equal intervals) across the range of the specs, in this case assuming the process is centered with a Ppk of 1.
- 8 of the 10 parts are selected randomly, and then one part each is used that lies one-half of a standard deviation outside of the specs.
Keep in mind that we know with absolute certainty that the underlying %Contribution is 5.88325%.
Random Sampling for Gage
Let's use "random" as the default to compare to, which, as you recall from Parts 1 and 2, already does not provide a particularly accurate estimate:
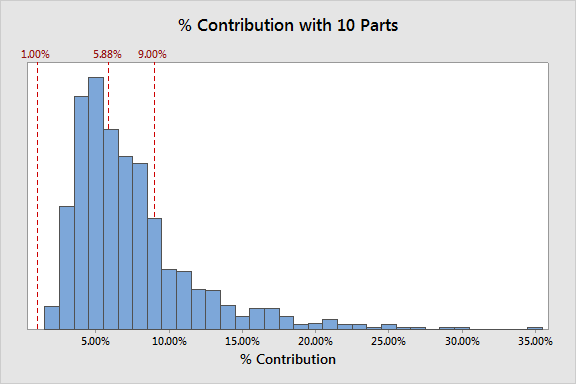
On several occasions I've had people tell me that you can't just sample randomly because you might get parts that don't really match the underlying distribution.
Sample 10 Parts that Match the Distribution
So let's compare the results of random sampling from above with our results if we could magically pull 10 parts that follow the underlying part distribution almost perfectly, thereby eliminating the effect of randomness:
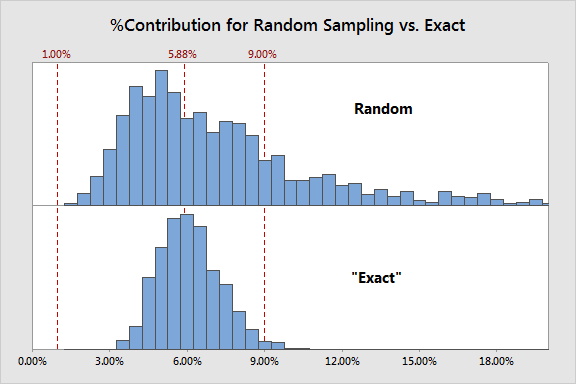
There's obviously something to the idea that the randomness that comes from random sampling has a big impact on our estimate of %Contribution...the "exact" distribution of parts shows much less skewness and variation and is considerably less likely to incorrectly reject the measurement system. To be sure, implementing an "exact" sample scheme is impossible in most cases...since you don't yet know how much measurement error you have, there's no way to know that you're pulling an exact distribution. What we have here is a statistical version of chicken-and-the-egg!
Sampling Uniformly across a Typical Range of Values
Let's move on...next up, we will compare the random scheme to scheme #2, sampling uniformly across a typical range of values:
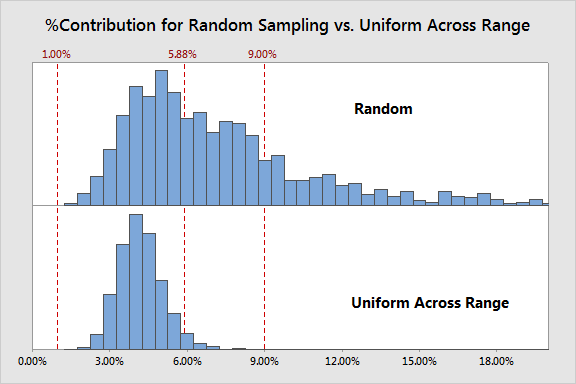
So here we have a different situation: there is a very clear reduction in variation, but also a very clear bias. So while pulling parts uniformly across the typical part range gives much more consistent estimates, those estimates are likely telling you that the measurement system is much better than it really is.
Sampling Uniformly across the Spec Range
How about collecting uniformly across the range of the specs?
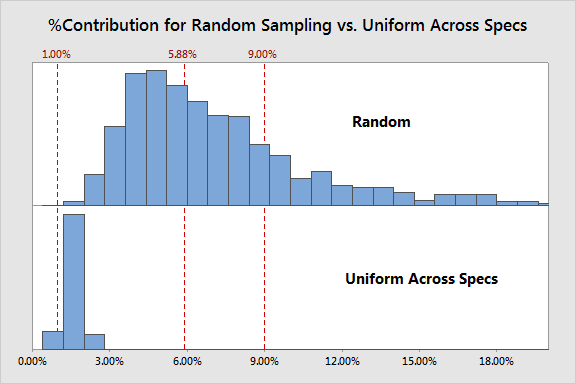
This scheme results in an even more extreme bias, with qualifying this measurement system a certainty and in some cases even classifying it as excellent. Needless to say it does not result in an accurate assessment.
Selectively Sampling Outside the Spec Limits
Finally, how about that scheme where most of the points are taken randomly but just one part is pulled from just outside of each spec limit? Surely just taking 2 of the 10 points from outside of the spec limits wouldn't make a substantial difference, right?
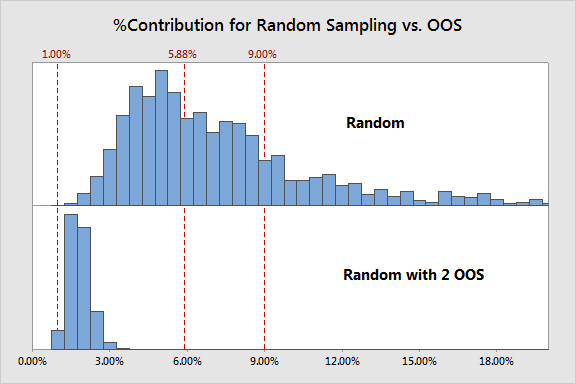
Actually those two points make a huge difference and render the study's results meaningless! This process had a Ppk of 1 - a higher-quality process would make this result even more extreme. Clearly this is not a reasonable sampling scheme.
Why These Sampling Schemes?
If you were taught to sample randomly, you might be wondering why so many people would use one of these other schemes (or similar ones). They actually all have something in common that explains their use: all of them allow a practitioner to assess the measurement system across a range of possible values. After all, if you almost always produce values between 8.2 and 8.3 and the process goes out of control, how do you know that you can adequately measure a part at 8.4 if you never evaluated the measurement system at that point?
Those that choose these schemes for that reason are smart to think about that issue, but just aren't using the right tool for it. Gage R&R evaluates your measurement system's ability to measure relative to the current process. To assess your measurement system across a range of potential values, the correct tool to use is a "Bias and Linearity Study" which is found in the Gage Study menu in Minitab. This tool establishes for you whether you have bias across the entire range (consistently measuring high or low) or bias that depends on the value measured (for example, measuring smaller parts larger than they are and larger parts smaller than they are).
To really assess a measurement system, I advise performing both a Bias and Linearity Study as well as a Gage R&R.
Which Sampling Scheme to Use?
In the beginning I suggested that a random scheme be used but then clearly illustrated that the "exact" method provides even better results. Using an exact method requires you to know the underlying distribution from having enough previous data (somewhat reasonable although existing data include measurement error) as well as to be able to measure those parts accurately enough to ensure you're pulling the right parts (not too feasible...if you know you can measure accurately, why are you doing a Gage R&R?). In other words, it isn't very realistic.
So for the majority of cases, the best we can do is to sample randomly. But we can do a reality check after the fact by looking at the average measurement for each of the parts chosen and verifying that the distribution seems reasonable. If you have a process that typically shows normality and your sample shows unusually high skewness, there's a chance you pulled an unusual sample and may want to pull some additional parts and supplement the original experiment.
Thanks for humoring me and please post scathing comments below!


