


Trying to remember what the alpha-level, p-value, and confidence interval all mean for a hypothesis test—and how they relate to one another—can seem about as daunting as Dorothy’s trek down the yellow brick road.
Rather than sitting through a semester of Intro Stats, let's get right to the point and explain in clear language what all these statistical terms mean and how they relate to one another.
 What Does Alpha Mean in a Hypothesis Test?
Before you run any statistical test, you must first determine your alpha level, which is also called the “significance level.” By definition, the alpha level is the probability of rejecting the null hypothesis when the null hypothesis is true.
Translation: It’s the probability of making a wrong decision.
Thanks to famed statistician R. A. Fisher, most folks typically use an alpha level of 0.05. However, if you’re analyzing airplane engine failures, you may want to lower the probability of making a wrong decision and use a smaller alpha. On the other hand, if you're making paper airplanes, you might be willing to increase alpha and accept the higher risk of making the wrong decision.
Like all probabilities, alpha ranges from 0 to 1.
What Is the P-Value of a Hypothesis Test?
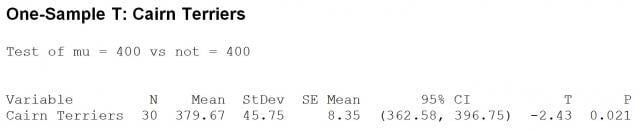
 Once you’ve chosen alpha, you’re ready to conduct your hypothesis test. Suppose you want to run a 1-sample t-test to determine whether or not the average price of Cairn terriers—like Dorothy’s dog Toto—is equal to, say, $400. You collect your sample data, put it in Minitab Statistical Software, and then arrive at your p-value.
Statistically speaking, the p-value is the probability of obtaining a result as extreme as, or more extreme than, the result actually obtained when the null hypothesis is true. If that makes your head spin like Dorothy’s house in a Kansas tornado, just pretend Glenda has waved her magic wand and zapped it from your memory. Then ponder this for a moment.
The p-value is basically the probability of obtaining your sample data IF the null hypothesis (e.g., the average cost of Cairn terriers = $400) were true. So if you obtain a p-value of 0.85, then you have little reason to doubt the null hypothesis. However, if your p-value is say 0.02, there’s only a very small chance you would have obtained that data if the null hypothesis was in fact true.
And since the p-value is a probability just like alpha, p-values also range from 0 to 1.
What Is the Confidence Interval for a Hypothesis Test?
When you run a hypothesis test, Minitab also provides a confidence interval. P-values and confidence intervals are like Dorothy and Toto—where you find one, you will likely find the other.
The confidence interval is the range of likely values for a population parameter, such as the population mean. For example, if you compute a 95% confidence interval for the average price of a Cairn terrier, then you can be 95% confident that the interval contains the true average cost of all Cairn terriers.
Interpreting Hypothesis Test Statistics
Now let's put it all together. These three facts should help you interpret the results of your hypothesis test.
Fact 1: Confidence level + alpha = 1
If alpha equals 0.05, then your confidence level is 0.95. If you increase alpha, you both increase the probability of incorrectly rejecting the null hypothesis and also decrease your confidence level.
Fact 2: If the p-value is low, the null must go.
If the p-value is less than alpha—the risk you’re willing to take of making a wrong decision—then you reject the null hypothesis. For example, if the p-value was 0.02 (as in the Minitab output below) and we're using an alpha of 0.05, we’d reject the null hypothesis and conclude that the average price of Cairn terrier is NOT $400.
If the p-value is low, the null must go. Alternatively, if the p-value is greater than alpha, then we fail to reject the null hypothesis. Or, to put it another way, if the p-value is high, the null will fly.
Fact 3: The confidence interval and p-value will always lead you to the same conclusion.
If the p-value is less than alpha (i.e., it is significant), then the confidence interval will NOT contain the hypothesized mean. Looking at the Minitab output above, the 95% confidence interval of 365.58 - 396.75 does not include $400. Thus, we know that the p-value will be less than 0.05.
If the p-value is greater than alpha (i.e., it is not significant), then the confidence interval will include the hypothesized mean.
I hope this post has helped to lift the curtain if you've had questions regarding alpha, the p-value, confidence intervals, and how they all relate to one another. If you want more details about these statistical terms and hypothesis testing, I’d recommend giving Quality Trainer a try. Quality Trainer is Minitab’s e-learning course that teaches you both statistical concepts and how to analyze your data using Minitab, and at a cost of only $30 US for one month, it’s well worth the investment.