Process validation is vital to the success of companies that manufacture pharmaceutical drugs, vaccines, test kits and a variety of other biological products for people and animals. According to FDA guidelines, process validation is “the collection and evaluation of data, from the process design state through commercial production, which establishes scientific evidence that a process is capable of consistently delivering a quality product.”
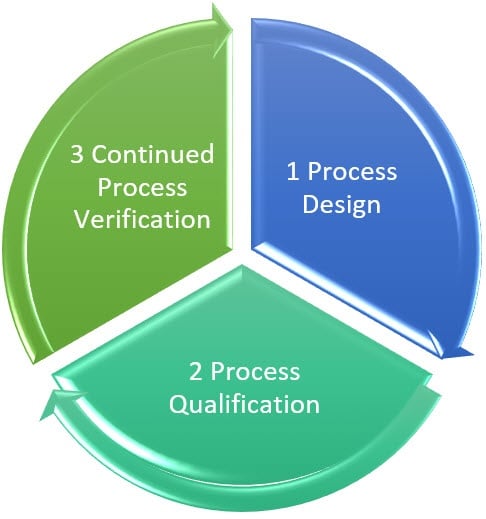
The FDA recommends three stages for process validation. Let’s explore the stage goals and the types of activities and statistical techniques typically conducted within each. You can use Minitab Statistical Software to run any of the analyses here. If you don’t yet have Minitab, try it free for 30 days.
Stage 1: Process Design
Goal: Design a process suitable for routine commercial manufacturing that can consistently deliver a product that meets its quality attributes.
It is important to demonstrate an understanding of the process and characterize how it responds to various inputs within Process Design.
Example: Identify critical process parameters with Design of Experiments (DOE)
Suppose you need to identify the critical process parameters for an immediate-release tablet. There are three process input variables that you want to examine:
- filler %
- disintegrant %
- particle size
You want to find which inputs and input settings will maximize the dissolution percentage at 30 minutes. DOE provides an efficient data collection strategy. Inputs are simultaneously adjusted to identify if relationships exist between inputs and output(s). (To learn more about DOE, check out 8 Expert Tips for Excellent Designed Experiments)
Running the Experiment: The first step in DOE is to identify the inputs and corresponding input ranges you want to explore. Next, create an experimental design that serves as your data collection plan.
According to the design shown in this table, we first want to use
- a particle size of 10
- disintegrant of 1%
- MCC at 33.3%
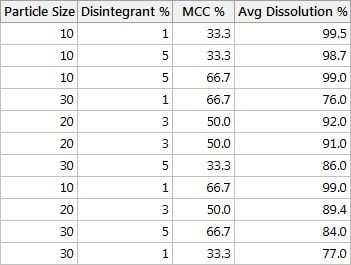
Then we'll record the corresponding average dissolution % using six tablets from a batch.
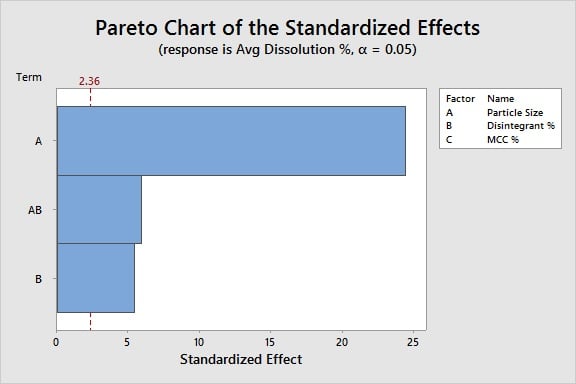
Analyzing the Data: Using DOE analysis and p-values, we are ready to identify which X's are critical. Based on the bars that cross the red significance line in this Pareto chart, we can conclude:
Particle size and disintegrant % significantly affect the dissolution %, as does the interaction between these two factors. Filler % is not significant.
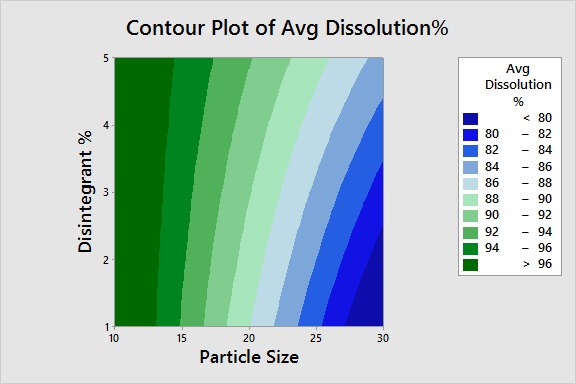
Optimizing Product Quality: Now that we've identified the critical X's, we're ready to determine the optimal settings for those inputs. Using a contour plot, we can easily identify the process window for the particle size and disintegrant % settings needed to achieve a percent dissolution of 80% or greater.
Stage 2: Process Qualification
Goal: evaluate the process design to determine if it is capable of reproducible commercial manufacture. Successful completion of Stage 2 is necessary before commercial distribution.
Example 1: Evaluate Acceptance Criteria with Capability Analysis
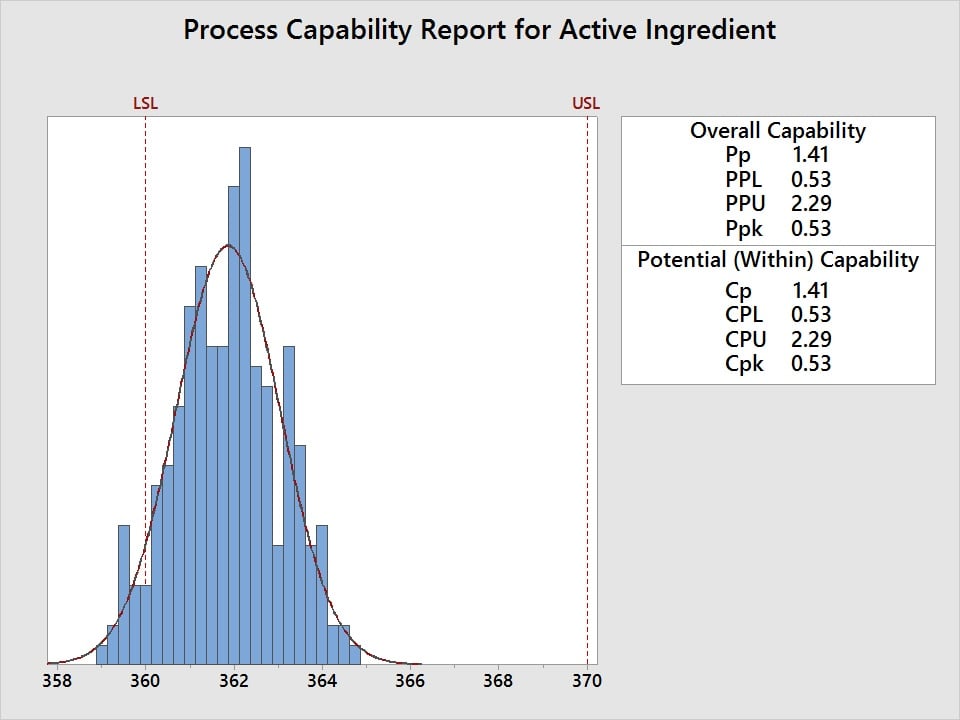
Suppose the active ingredient amount in a tranquilizer needs to be between 360 and 370 mg/mL and you need to assess the quality level, where a minimum Cpk of 1.33 is defined as the acceptance criteria. To assess process performance and determine if measurements are within specification, use capability analysis. Five samples are randomly selected from 50 batches and the amount of active ingredient is measured. The data is then analyzed relative to the 360 mg/mL minimum and 370 mg/mL maximum.
The capability analysis reveals a Cpk of 0.53, which fails to meet the acceptance criteria of 1.33. The active ingredient amounts for this tranquilizer are not acceptable. So how can we improve it?
The Cp value of 1.41 and the graph both reveal that, although the variability is acceptable with respect to the width of the specification limits, the process average needs to be shifted to a higher mg/mL in order to achieve an acceptable Cpk.
Example 2: Conduct Variation Analysis across Batches with Boxplots
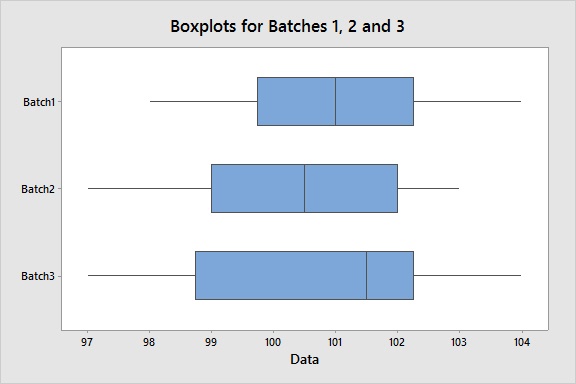
Suppose we want to assess content uniformity – a critical quality characteristic – across three batches at 10 locations. To visualize the intra-batch variation and the inter-batch variation and identify any outliers, we can create boxplots for each batch. This specific graph shows a homogeneous dispersion of measurements both within each batch and between batches. And there are no outliers, which Minitab would flag with an asterisk (*).
Although boxplots are useful tools to conduct a visual assessment, we can also statistically assess if there is a significant difference in the between batch variation using an equal variances test. The test reveals a p-value greater than an alpha-level of 0.05 (or whatever alpha-level you prefer), which supports the conclusion that there is consistency between batches.
Example 3: Various Applications for Tolerance Intervals
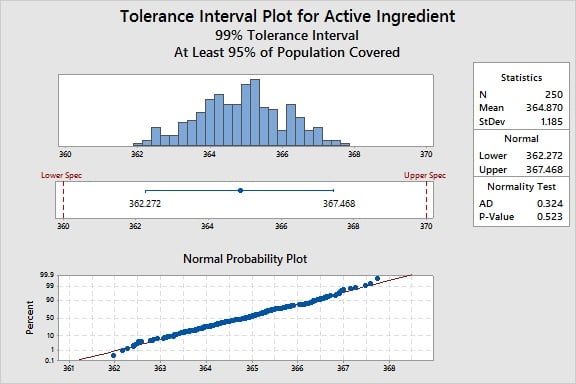
Another useful tool for Process Qualification is the tolerance interval. This tool has multiple applications. For example, tolerance intervals can be used to compare your process to specifications, profile the outcome of a process, or establish acceptance criteria.
For a given product characteristic, a tolerance interval provides a range of values that likely covers a specified proportion of the population (for example, 95%) for a specified confidence level (like 99%).
For example, suppose we want to know how the active ingredient values in the manufacturing process compare to our specification limits. Based on a dose-response study, the limits are 360 to 370 mg/mL.
For this particular data set, Minitab reveals that we can be 99% confident that 95% of the units will be between 362.272 and 367.468 mg/mL. The process bounds therefore indicate that we can meet the requirements of 360 to 370, and we can conclude with high confidence that the process variation is less than the allowable variation, defined by the specification limits.
Or perhaps we need to assess content uniformity using 99% confidence and 99% coverage. We sample 30 tablets and calculate a tolerance interval, revealing that we can be 99% certain that 99% of the tablets will have a content uniformity within some range, calculated using Minitab.
Stage 3: Continued Process Verification
Goal: provide continual assurance the process remains in a state of control – the validated state – during commercial manufacture.
Example: Monitor a Process with Control Charts
Suppose you are responsible for monitoring an oral tablet manufacturing process. You need to demonstrate that hardness is stable over time and detect if the process variation has shifted and therefore requires attention.
You also want to make sure production line operators do not overreact to minor changes in the data, which are inherent in routine variability. Avoiding overreaction prevents unnecessary process adjustments that may actually result in an unintentional increase in variability.
You sample five tablets per hour, measure their hardness, and then create an Xbar-R control chart.
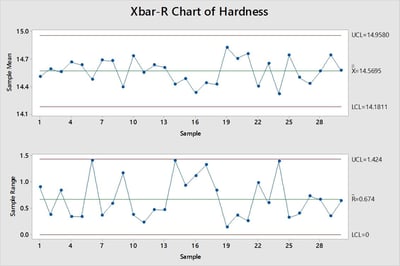
This Xbar-R chart does not reveal any points flagged in red, and therefore shows that the process is in statistical control. You can conclude that you are maintaining the validated state of the process, and that there aren’t any unwanted, unusual shifts in either the process mean (per the upper Xbar chart) or variation (per the lower R chart) that have been detected.
If the control chart had revealed an out-of-control state—a process exposed to unanticipated sources of variation—then next steps would include characterizing the issue and conducting a root cause investigation. Was there a change in material characteristics? Is there an equipment maintenance or calibration issue? Or is there some other source of variability that provoked a process shift?
Wrapping Up
Failure to detect undesirable process variation can be mitigated with routine monitoring and control charting. In addition to control charts and the statistical tools commonly used for the Process Design, Process Qualification and Continued Process Verification stages, there are other useful statistical techniques to support you in your process validation efforts. For example, Minitab also includes acceptance sampling to help you calculate the number of samples to take and use a randomly drawn sample of product to determine whether to accept or reject an entire lot.


