Have you shopped online to buy gifts this holiday season? With Cyber Monday (the Monday following Black Friday) offering shoppers free shipping and other great discounts for buying online, it’s hard not to take advantage of virtual deals.
I find myself purchasing more and more of my Christmas list online every year, and after comScore’s recent release of this year’s online holiday spending statistics in the U.S., it’s no surprise to me that overall online spending for the first 37 days of the November-December shopping season is up 13% from 2011.
Take a look at this bar chart I created in Minitab using comScore’s online holiday spending data for Cyber Monday from 2005-2012:
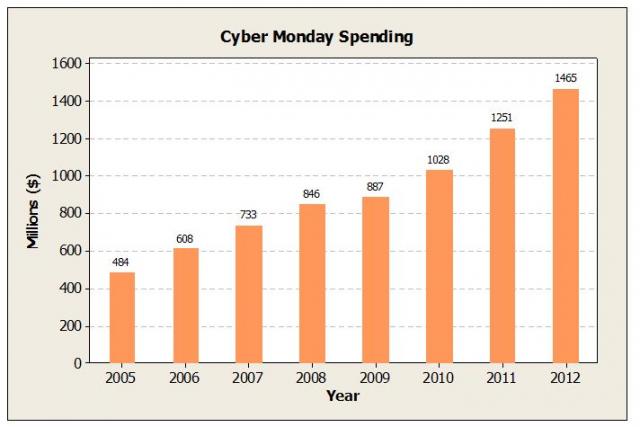
Notice steady growth since 2005, and a 17% increase in Cyber Monday spending from last year. Where does Cyber Monday spending fall in comparison to other popular times for online shopping, such as Thanksgiving Weekend, Black Friday, and Thanksgiving Day? We’ll look at this more closely later in the post.
Tip: To add the data labels to your bars like I have done here, right click on the graph and choose Add > Data Labels > OK.
A Case of the Mondays: Cyber or Green?
From 2005-2008, Green Monday (which is an online shopping day occurring the second Monday in December each year) surpassed the online spending of Cyber Monday, according to comScore. “Green Monday” was coined by eBay in 2007 because of the widely held misconception at the time that Cyber Monday was the heaviest shopping day of the season. However, the chart below shows that Cyber Monday spending really has been surpassing Green Monday sales in recent years – perhaps due to the increase in ‘free shipping’ promotions many retailers are offering earlier in the month of December?
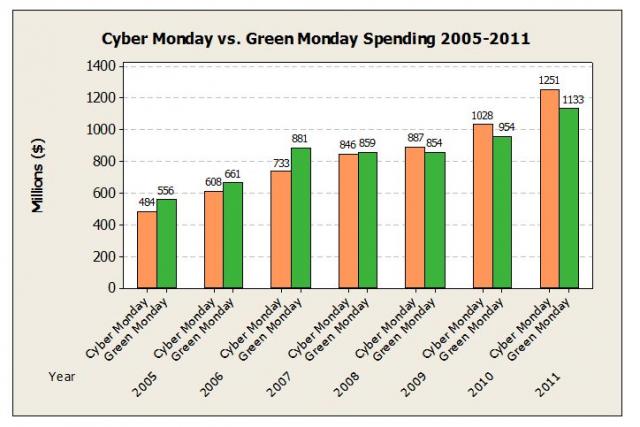
Note that the chart does not include stats for 2012 because at the time this post was published, there was no data available for this year’s Green Monday sales. Green Monday fell on December 10, 2012.
The stats are available for overall online spending for Cyber Monday 2012. If you look back to the first chart in this post, you’ll see that overall online spending for Cyber Monday was a whopping $1.46 billion this year.
Overall Online Holiday Spending
I did a post last December that discussed online holiday spending stats for 2010 and 2011. Since there’s new data to display now that the 2012 shopping season is well underway, I updated my graphs to compare online holiday spending over 2010, 2011, and 2012 for some of the key shopping times (Cyber Monday, Thanksgiving Weekend, Black Friday, and Thanksgiving Day).
In Minitab, I added the 2012 spending data to my worksheet and created this stacked bar chart to view all three years:
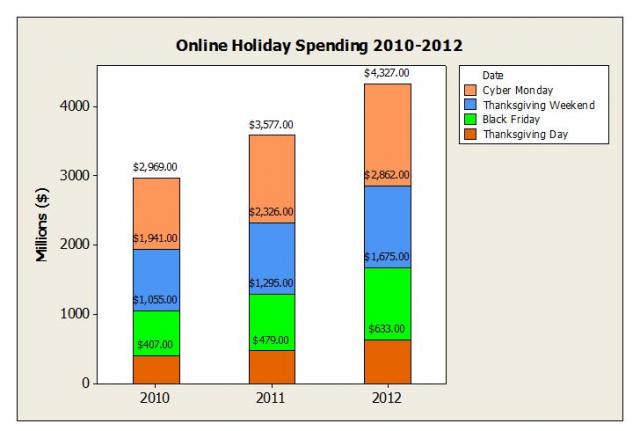
The stacked option (Graph > Bar Chart > Stack) makes it easy to compare the overall online spending of all three years over the four key shopping periods. To drill down even further, and to see what percent of each year’s overall online spending is made up by each shopping period category, check out these paneled pie charts (Graph > Pie Chart):
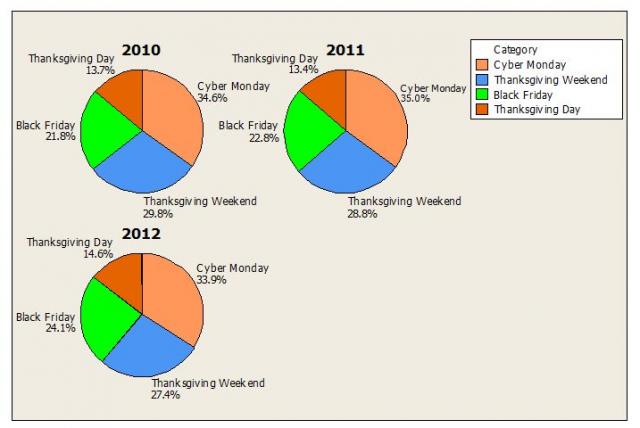
The pie charts make it even easier to see that the percentage of Cyber Monday sales is the category with the highest spending over all three years we looked at. It’s also interesting to note that the percentage of Cyber Monday spending over the three years varies slightly each year, and even looks to be decreasing in 2012 (2010=34.6%, 2011=35.0%, 2012=33.9%).
And to compare each shopping period a little more closely and to see differences among them, I chose the cluster option for Bar Charts:
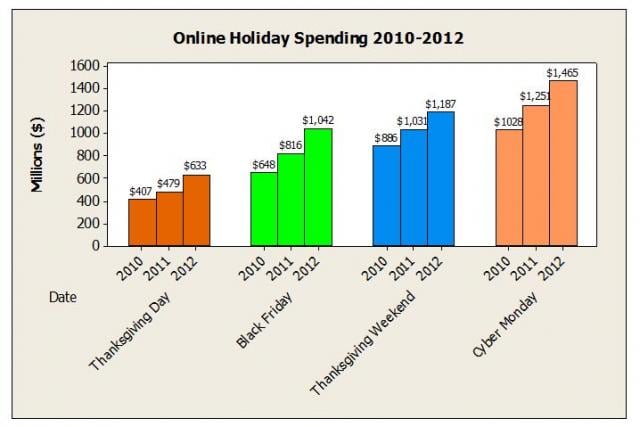
Tip: Updating graphs you’ve already created is easy to do in Minitab. After creating your graph, select the graph, right click, and choose Update Graph Automatically. Now each time you update data in the worksheet that is tied to your graph, the graph will update automatically with any changes you made in your worksheet. You can also easily duplicate a graph you already created by choosing Editor > Duplicate Graph.
There are lots of options to present your data visually in Minitab, and each different chart or graph you use may lead you to new insights about your data!
Do you think online holiday shopping will continue to rise in popularity with shoppers?
I don’t think we’ll see any malls close their doors in any of our lifetimes, but I do think the number of online shoppers is increasing, at least for the holidays. I’ve noticed even more traditional shoppers, like my parents for example, are hitting more clicks of the mouse and less of the stores.


