


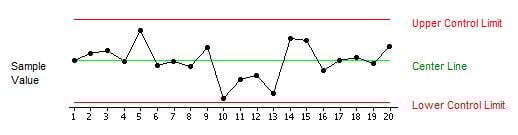
Control charts are used to monitor the stability of processes, and can turn time-ordered data for a particular characteristic—such as product weight or hold time at a call center—into a picture that is easy to understand. These charts indicate when there are points out of control or unusual shifts in a process.
Statistically speaking, control charts help you detect nonrandom sources of variation in the data. In other words, they separate variation due to common causes from variation due to special causes, where:
- Common cause variation is variation that is naturally inherent in a process, and always present.
- Special cause variation represents assignable or unusual sources of variation that are not typically part of a process. Special causes can be either detrimental or beneficial to a process.
(My colleague has gone into further detail about the different types of variation in another post.)
Statistical software like Minitab makes it easy to create and interpret control charts, but those charts are useless if they aren’t created using the right “subgroups” of your data. Understanding and choosing a rational subgroup size before you collect your data and create control charts is critical, but the concept is often misunderstood.
What Are Rational Subgroups?
A rational subgroup is a group of units produced under the same set of conditions. Rational subgroups are meant to represent a “snapshot” of the process. They also reflect how your data are collected, and represent the inherent (common cause) variation in your process at any given time.
For many processes, you can form rational subgroups by sampling multiple observations that are close together in time, but still independent of each other. For example, a die cut machine produces 100 plastic parts per hour. The quality engineer measures five randomly selected parts at the beginning of every hour. Each sample of five parts is a subgroup.
Within Subgroup vs. Between Subgroup Variation
You can use subgroups to separate the two types of variation in a process:
- Within subgroup: the variation among measurements within subgroups; also known as common cause variation.
- Between subgroup: the variation between subgroups that may be caused by specific identifiable factors, or special causes.
The control limits on a control chart are calculated using the variability “within” the subgroups. Therefore, it’s important to select the subgroup so that only the common cause variation in the process is represented. The goal is to improve process quality, by eliminating between subgroup variation and reducing within subgroup variation. It’s also extremely important to remember that the subgroup information you specify in Minitab when you’re creating your control chart reflects how the data were collected.
Interactive Rational Subgrouping with Marshmallow Peeps!
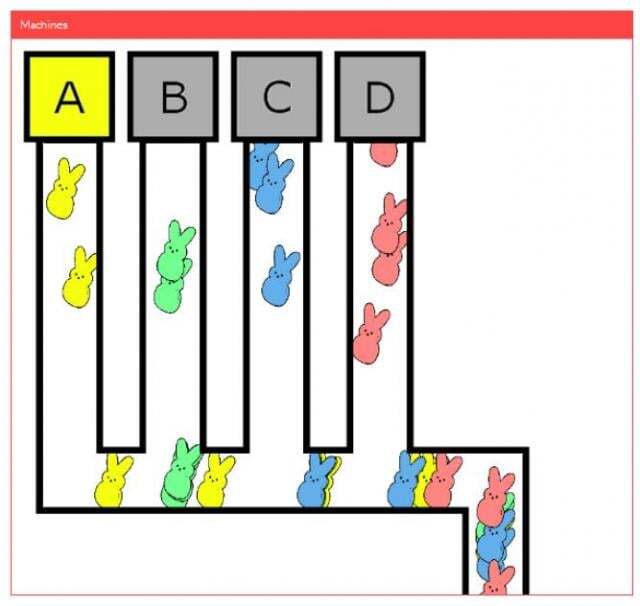
To illustrate the topic of subgrouping and different subgrouping methods to her statistics and Six Sigma students, Dr. Diane Evans, associate professor of mathematics at Rose-Hulman Institute of Technology, incorporated a hands-on lab into her instruction that features Marshmallow Peeps!
The interactive lesson places students as Statistical Process Control (SPC) operators in a manufacturing setting where Peeps are produced by four different machines. The operators explore different subgrouping arrangements in order to supply the best possible information to their stakeholders about Peep “sponginess.” Computer science students at Rose-Hulman even developed a special “Peep Simulator” to aid the classes in collecting the data, http://www.rose-hulman.edu/~evans/peeps/php/new.php:
If you’re attending the upcoming ASQ World Conference in Indianapolis May 6-8, Dr. Evans will present this exercise at 8:00 a.m. in Wasbash 1. For more information on her presentation, check out the session details page.
We hope to see you there!
Of possible interest: