


My previous post examined how an equivalence test can shift the burden of proof when you perform hypothesis test of the means. This allows you to more rigorously test whether the process mean is equivalent to a target or to another mean.
Here’s another key difference: To perform the analysis, an equivalence test requires that you first define, upfront, the size of a practically important difference between the mean and the target, or between two means.
Truth be told, even when performing a standard hypothesis test, you should know the value of this difference. Because you can’t really evaluate whether your analysis will have adequate power without knowing it. Nor can you evaluate whether a statistically significant difference in your test results has significant meaning in the real world, outside of probability distribution theory.
But since a standard t-test doesn’t require you to define this difference, people often run the analysis with a fuzzy idea, at best, of what they’re actually looking for. It’s not an error, really. It’s more like using a radon measuring device without knowing what levels of radon are potentially harmful.
Defining Equivalence Limits: Your Call
How close does the mean have to be to the target value or to another mean for you to consider them, for all practical purposes, “equivalent”?
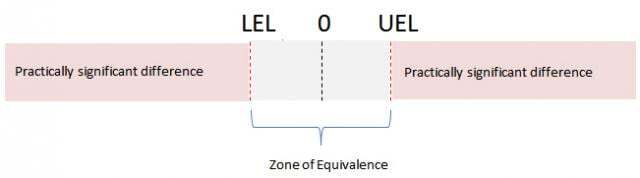
The zone of equivalence is defined by a lower equivalence and/or an upper equivalence limit. The lower equivalence limit (LEL) defines your lower limit of acceptability for the difference. The upper equivalence limit (UEL) defines your upper limit of acceptability for the difference. Any difference from the mean that falls within this zone is considered unimportant.
In some fields, such as the pharmaceutical industry, equivalence limits are set by regulatory guidelines. If there aren’t guidelines for your application, you’ll need to define the zone of equivalence using knowledge of your product or process.
Here’s the bad news: There isn’t a statistician on Earth who can help you define those limits. Because it isn’t a question of statistics. It’s a question of what size of a difference produces tangible ramifications for you or your customer.
A difference of 0.005 mg from the mean target value? A 10% shift in the process mean? Obviously, the criteria aren't going to be the same for the diameter of a stent and the diameter of a soda can.
Equivalence Test in Practice
Here's a quick example of a 1-sample equivalence test, adapted from Minitab Help.To follow along, you can download the revised data here. If you don't have Minitab, download a free trial version here.
Suppose a packaging company wants to ensure that the force needed to open its snack food bags is within 10% of the target value of 4.2N (Newtons). From previous testing, they know that a force lower than 10% below the target causes the bags to open too easily and reduces product freshness.A force above 10% of the target makes the bags too difficult to open. They randomly sample 100 bags and measure the force required to open each one.
To test whether the mean force is equivalent to the target, they choose Stat > Equivalence Tests > 1-Sample and fill in the dialog box as shown below:
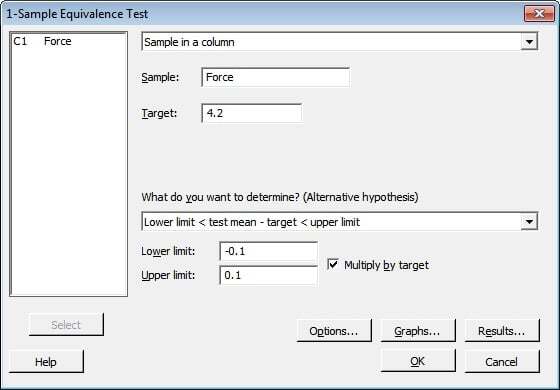
Tip: Use the Multiply by Target box when you want to define the equivalence limits for a difference in terms of a percentage of the target. In this case, the lower limit is 10% less than the target. The upper limit is 10% higher than the target. If you want to represent the equivalence limits in absolute terms, rather than as percentages, simply enter the actual values for your equivalence limits and don't check the Multiply by Target box.
When you click OK, Minitab displays the following results:
One-Sample Equivalence Test: Force
Difference: Mean(Force) - Target
Difference SE 95% CI Equivalence Interval
0.14270 0.067559 (0, 0.25487) (-0.42, 0.42)
CI is within the equivalence interval. Can claim equivalence.
Test
Null hypothesis: Difference ≤ -0.42 or Difference ≥ 0.42
Alternative hypothesis: -0.42 < Difference < 0.42
α level: 0.05
Null Hypothesis DF T-Value P-Value
Difference ≤ -0.42 99 8.3290 0.000
Difference ≥ 0.42 99 -4.1046 0.000
The greater of the two P-Values is 0.000. Can claim equivalence.
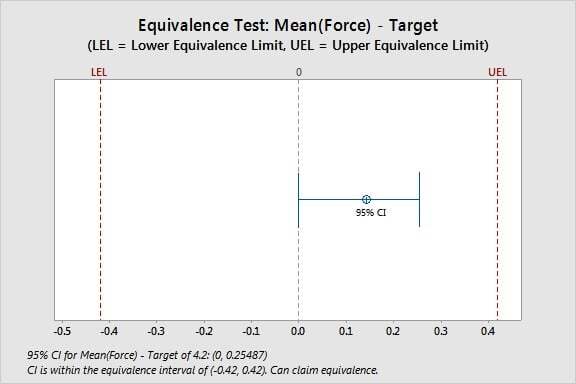
Because the confidence interval for the difference falls completely within the equivalence limits, you can reject the null hypothesis that the mean differs from the target. You can claim that the mean and the target are equivalent.
Notice that if you had used a standard 1-sample t-test to analyze these data, the output would show a statistically significant difference between the mean and the target (at a significance level of 0.05):
One-Sample T: Force
Test of μ = 4.2 vs ≠ 4.2
Variable N Mean StDev SE Mean 95% CI T P
Force 100 4.3427 0.6756 0.0676 (4.2086, 4.4768) 2.11 0.037
These two sets of results aren't really contradictory, though.
The equivalence test has simply defined "equality" between the mean and the target in broader terms, using the values you entered for the equivalence zone. The standard t-test has no knowledge of what "practically significant' means. So it can only evaluate the difference from the target in terms of statistical significance.
In this way, an equivalence test is "naturally smarter" than a standard t-test. But it's your knowledge of the process or product that allows an equivalence test to evaluate the practical significance of a difference, in addition to its statistical significance.
Learn More about Equivalence Testing
There are four types of equivalence tests newly available in Minitab. To learn more about each test, choose Help > Help. Click the Index tab, scroll down to Equivalence testing, and click Overview.