If you’re not a statistician, looking through statistical output can sometimes make you feel a bit like Alice in Wonderland. Suddenly, you step into a fantastical world where strange and mysterious phantasms appear out of nowhere.
For example, consider the T and P in your t-test results.
“Curiouser and curiouser!” you might exclaim, like Alice, as you gaze at your output.
What are these values, really? Where do they come from? Even if you’ve used the p-value to interpret the statistical significance of your results umpteen times, its actual origin may remain murky to you.
T & P: The Tweedledee and Tweedledum of a T-test
T and P are inextricably linked. They go arm in arm, like Tweedledee and Tweedledum. Here's why.
When you perform a t-test, you're usually trying to find evidence of a significant difference between population means (2-sample t) or between the population mean and a hypothesized value (1-sample t). The t-value measures the size of the difference relative to the variation in your sample data. Put another way, T is simply the calculated difference represented in units of standard error. The greater the magnitude of T, the greater the evidence against the null hypothesis. This means there is greater evidence that there is a significant difference. The closer T is to 0, the more likely there isn't a significant difference.
Remember, the t-value in your output is calculated from only one sample from the entire population. It you took repeated random samples of data from the same population, you'd get slightly different t-values each time, due to random sampling error (which is really not a mistake of any kind–it's just the random variation expected in the data).
How different could you expect the t-values from many random samples from the same population to be? And how does the t-value from your sample data compare to those expected t-values?
You can use a t-distribution to find out.
Using a t-distribution to calculate probability
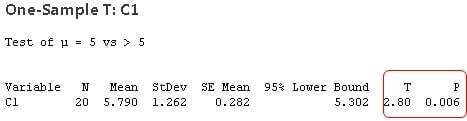
For the sake of illustration, assume that you're using a 1-sample t-test to determine whether the population mean is greater than a hypothesized value, such as 5, based on a sample of 20 observations, as shown in the above t-test output.
- In Minitab, choose Graph > Probability Distribution Plot.
- Select View Probability, then click OK.
- From Distribution, select t.
- In Degrees of freedom, enter 19. (For a 1-sample t test, the degrees of freedom equals the sample size minus 1).
- Click Shaded Area. Select X Value. Select Right Tail.
- In X Value, enter 2.8 (the t-value), then click OK.
The highest part (peak) of the distribution curve shows you where you can expect most of the t-values to fall. Most of the time, you’d expect to get t-values close to 0. That makes sense, right? Because if you randomly select representative samples from a population, the mean of most of those random samples from the population should be close to the overall population mean, making their differences (and thus the calculated t-values) close to 0.
Ready for a demo of Minitab Statistical Software? Just ask!

T values, P values, and poker hands
T values of larger magnitudes (either negative or positive) are less likely. The far left and right "tails" of the distribution curve represent instances of obtaining extreme values of t, far from 0. For example, the shaded region represents the probability of obtaining a t-value of 2.8 or greater. Imagine a magical dart that could be thrown to land randomly anywhere under the distribution curve. What's the chance it would land in the shaded region? The calculated probability is 0.005712.....which rounds to 0.006...which is...the p-value obtained in the t-test results! 
In other words, the probability of obtaining a t-value of 2.8 or higher, when sampling from the same population (here, a population with a hypothesized mean of 5), is approximately 0.006.
How likely is that? Not very! For comparison, the probability of being dealt 3-of-a-kind in a 5-card poker hand is over three times as high (≈ 0.021).
Given that the probability of obtaining a t-value this high or higher when sampling from this population is so low, what’s more likely? It’s more likely this sample doesn’t come from this population (with the hypothesized mean of 5). It's much more likely that this sample comes from different population, one with a mean greater than 5.
To wit: Because the p-value is very low (< alpha level), you reject the null hypothesis and conclude that there's a statistically significant difference.
In this way, T and P are inextricably linked. Consider them simply different ways to quantify the "extremeness" of your results under the null hypothesis. You can’t change the value of one without changing the other.
The larger the absolute value of the t-value, the smaller the p-value, and the greater the evidence against the null hypothesis.(You can verify this by entering lower and higher t values for the t-distribution in step 6 above).
Try this two-tailed follow up...
The t-distribution example shown above is based on a one-tailed t-test to determine whether the mean of the population is greater than a hypothesized value. Therefore the t-distribution example shows the probability associated with the t-value of 2.8 only in one direction (the right tail of the distribution).
How would you use the t-distribution to find the p-value associated with a t-value of 2.8 for two-tailed t-test (in both directions)?
Hint: In Minitab, adjust the options in step 5 to find the probability for both tails. If you don't have a copy of Minitab, download a free 30-day trial version.