In my last post we looked at the results of my measurement systems analysis using a gage linearity and bias study, and got results that we expected: measuring distances of even a few feet with a 6-inch protractor is hard, and gets harder the greater the distance is. But Minitab Statistical Software can help you to notice another effect that’s present. An effect that you’d certainly want to know about in real life. If you do this activity on your own or with a group, you’ll probably find some interesting trends by doing a time series plot of the data.
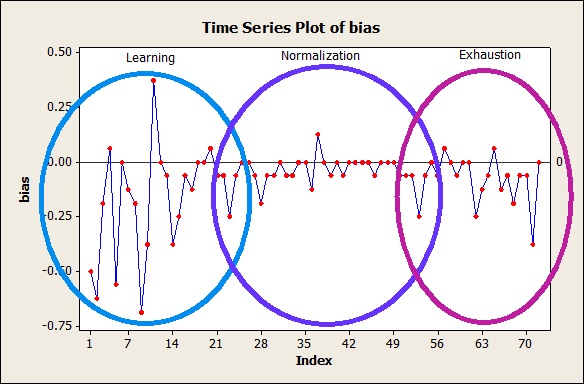
Here’s a simple plot that shows how far off I was in each measurement I made in sequence:

This plot shows what I think of as 3 distinct phases of the process of measuring gummi bears:
- Learning
- Normalizing
- Exhaustion
Learning
Because I knew the reference measurements I was trying to hit, I adjusted my measurement process as I took more measurements. When you conduct a real study, the operators who do the measurements shouldn’t know what the reference value is, but they might be able to make a pretty accurate guess before they’re done. Knowing my measurements were too short in the measurement systems analysis I did with the Type 1 Gage Study, I made adjustments. I used a piece of paper instead of my finger to mark where the protactor ended, but it took some practice to get the flimsy piece of paper to stay where it should go.
Normalizing
Once I did have the piece of paper better figured out, my measurements become much less variable. A lot of them were really close to the real value, too -- off by less than a quarter of an inch. It's a great feeling when your measurement systems analysis shows that your measurements are precise and accurate.
Exhaustion
But there’s only so many times you can measure the same gummi bears before it occurs to you that speed is more important than accuracy. Even if your operators are highly motivated, you might find that precision and accuracy suffer because of how long or how hard someone has been working. In a training exercise like this, you should expect to see the exhaustion effect take hold.
So What?
Ideally, the statistics that we’re calculating describe a measurement process that operates consistently. If your measurement systems analysis shows training improvements or exhaustion effects, do your best to find ways to eliminate those two effects. If not, then sometimes your measurement process isn’t as good as you think it is, and sometimes it’s better than you think it is. Make sure that everyone’s trained and agrees on the measurement process. Estimate how long until exhaustion sets in and make plans to avoid exhaustion.


