


by Matthew Barsalou, guest blogger
The field of statistics has a long history and many people have made contributions over the years. Many contributors to the field were educated as statisticians, such as Karl Pearson and his son Egon Pearson. Others were people with problems that needed solving, and they developed statistical methods to solve these problems.
The Standard Normal Distribution
One example is Karl Gauss and the standard normal distribution, which is a key element in statistics. The distribution was used by Gauss to analyze astronomical data in the early nineteenth century and is also known as the Gaussian distribution or more simply, the bell curve.
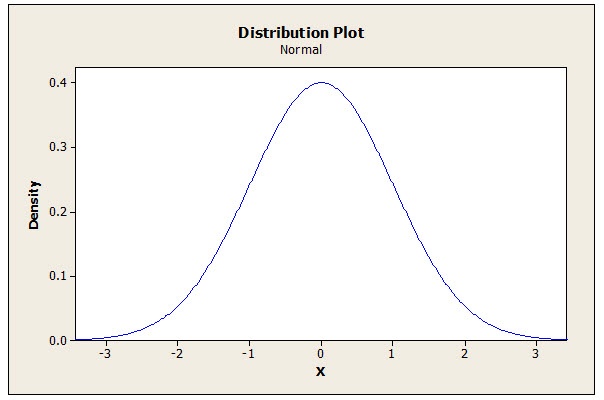
Any normal distribution can easily be converted into the standard normal distribution based on a Z score table. The standard normal distribution is often used when comparing the means of either large samples or populations. For example, an engineer may perform hypothesis testing using the standard normal distribution to compare before-and-after results when attempting to increase the mean of a manufacturing process.
Student's t Distribution
The well-known Student’s t distribution was created by a Guinness brewery employee named William Sealy Gosset, who published in the journal Biometrika under the name Student. Guinness did not permit its employees to publish because of fear of the competition learning about what they were doing, hence Gosset published under a pseudonym.
Gosset created Student's t distribution because previous formulas for estimating the error of samples required a large sample size and Gosset had found that there were often only small samples available. Student’s t distribution is used for small sample sizes and approaches the standard normal distribution as sample size increases.
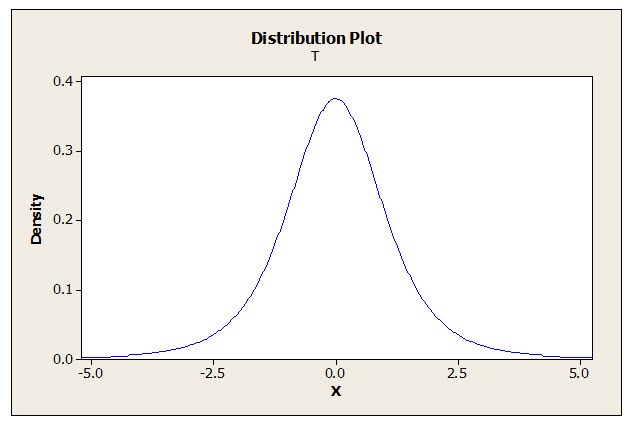
This aspect permitted Gosset to perform experiments with small sample sizes, and this distribution is just as useful in industry today as it was when Gosset created it. For example, small sample sizes are more economical if a manufacturer wanted to perform experiments on expensive products and the experiments required destructive testing.
Shewhart and Control Charts
In 1924, Walter A. Shewhart presented the management of Western Electric’s Hawthorne plant with his concept of statistical process control (SPC). In his 1931 book Economic Control of Quality of Manufactured Product, Shewhart explained that eliminating assignable causes of variation would lead to a reduced level of inspection and therefore both higher quality and lower costs.
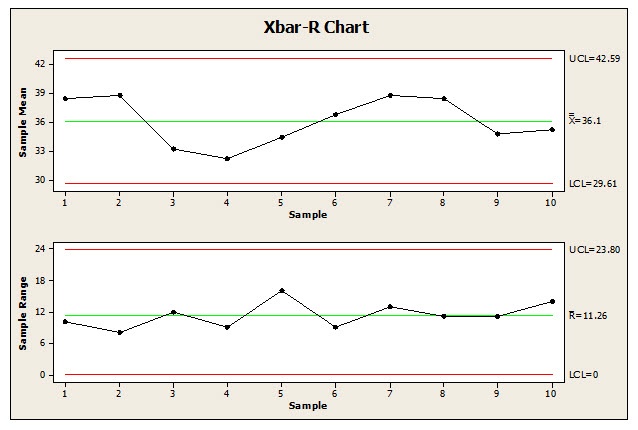
Using control charts such as an Xbar-R chart, a manufacturer can quickly tell when a process is at risk of producing defective parts without needing to individually inspect every item after production. Control charts can also detect a problem before hundreds or thousands of defective parts have been produced.
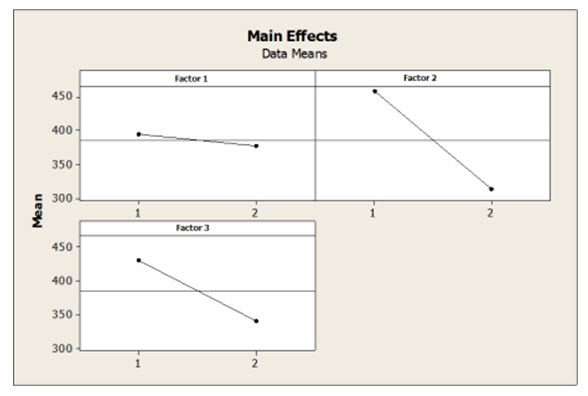
Design of Experiments
Four years after Shewhart published Economic Control of Quality of Manufactured Product, Ronald A. Fisher published his classic work The Design of Experiments. Fisher explained the proper methodology for performing Design of Experiments (DOE).
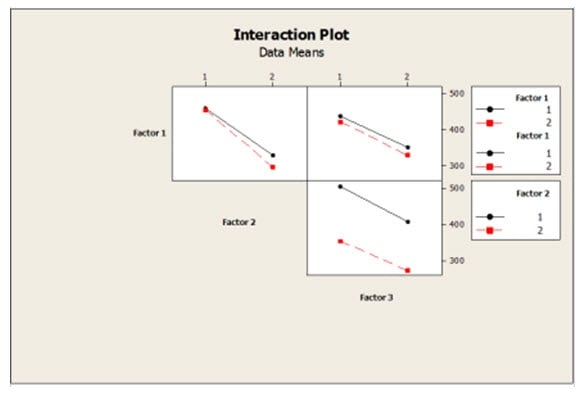
Today, DOE is frequently used in industry for performing experiments and is a key part of the Six Sigma quality improvement methodology. One of the great advantages of DOE is the ability to reduce the number of experimental runs required to get usable results. An experiment performed using DOE can provide the experimenter with information on the main effects of varying the levels of the experimental factors, as well as the interactions between the factors when the levels are varied.
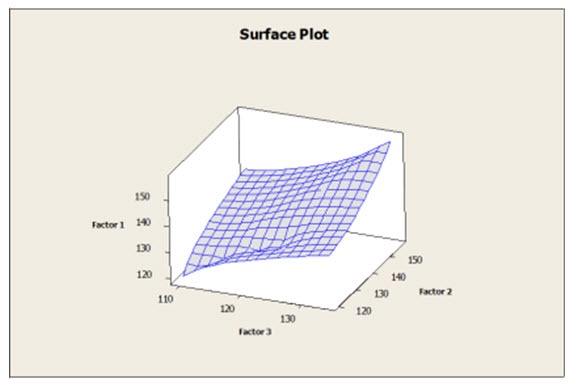
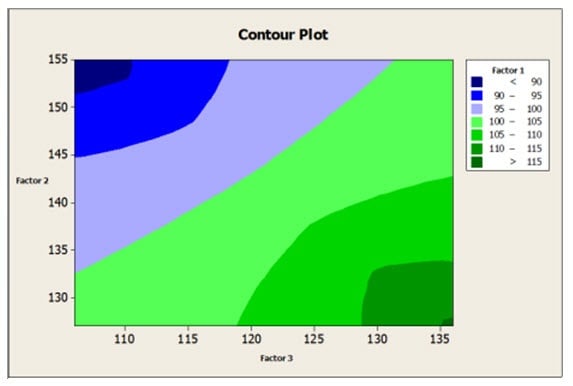
Fisher’s future son-in-law George E. P. Box, with K. B. Wilson, further advanced DOE. They introduced the concept of Response Surface Methodology (RSM) in 1951. This variation on DOE is used to determine the relationship between multiple factors and one or more output variables in order to determine an optimal response. It can be used for process improvement, troubleshooting, and for making a product more robust to outside influences. Response surface methods can be used to produce both surface and contour plots for analyzing the effects of varying influence factors on a product or process.
The Weibull Distribution
The Weibull distribution is named for E. H. Waloddi Weibull and is frequently used in the field of reliability engineering. Weibull was not the first to discover the distribution that bears his name; however, he brought the Weibull distribution to prominence when he introduced in to the American Society of Mechanical Engineers (ASME) in 1951.
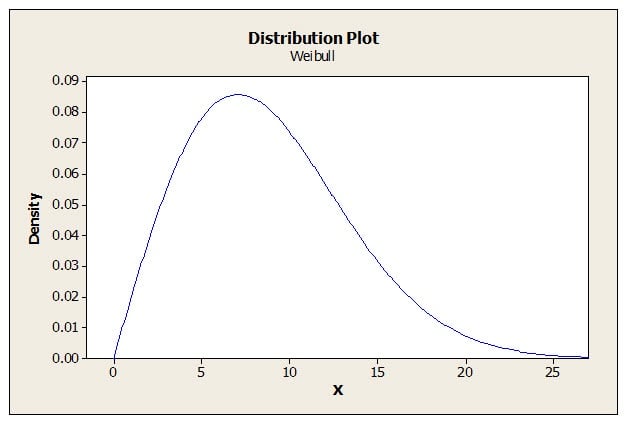
This distribution is used to determine the time-to-failure for parts or systems. The Weibull distribution changes shape as parameters change and it can even approach the shape of the standard normal distribution.
The Common Factor in These Methods
This brief discussion can't cover all statistical methods used in industry, nor all of the discoverers who have contributed to statistical methods. There are, however, commonalities amongst the statistical methods presented here. These breakthroughs in statistics were not discovered by people seeking a breakthrough in statistics; rather, they were found by people who had a problem to solve.
Much of Gauss’ work was done in the field of astronomy, and Gosset was trying to brew good beer at a low cost. Shewhart was at an industrial research laboratory, and Fisher was made his contributions to experimental design when he was attempting to interpret massive quantities of data resulting from years of agricultural experimentation.
Box was a chemist by education, but was confronted with a statistical problem and learned statistics because no other statistician was available to help him. In addition to publishing his namesake distribution, Weibull frequently published on practical engineering-related subjects, such as material strength and material fatigue.
The field of statistics has progressed over the past two centuries and we can expect that it will continue to give us new practical methods to find solutions to real-world problems. Statistics is now an essential part of the modern quality engineer’s body of knowledge.
Perhaps somewhere, right now, an engineer facing a problem on the production floor is creating yet another new statistical method for solving a real-world problem.