


Life is full of choices. Some are simple, such as what shirt to put on in the morning (although if you’re like me, it’s not so much of a “choice” as it is throwing on the first thing you grab out of the closet). And some choices are more complex. In the quality world, you might have to determine which distribution to choose for your capability analysis or which factor levels to use to bake the best cookie in a design of experiments. But all of these choices pale in comparison* to the most important decision you have to make each year: which college basketball teams to pick during March Madness!
*may not actually pale in comparison
When it comes to filling out your bracket, you have a lot of information at your disposal. Some people pick teams based on colors, others use mascots, and some even use the RPI! But being the statistics nerd that I am, I like to use ranking systems created by other statistics nerds. Two of the most popular rankings are the Pomeroy Ratings and the Jeff Sagarin Ratings. However, there are numerous others. ESPN has the BPI, Ken Massey has the Massey Ratings, professors at Georgia Tech created the LRMC Rankings, and the list goes on and on. With all these choices, we better perform a data analysis to determine which one is best!
Last year I created a regression model that calculates the probability one team has of beating the other given the rankings of the two teams. I’ll use this model to help determine which ranking system is the most accurate!
Now, it’s not as simple as seeing which ranking system predicts the most number of games correctly. Most of the time there is a clear favorite, and all of the ranking systems agree. What I’m more interested in is how accurate the system’s probability is. For example, if there are 10 games where the ranking system says the favorite should win 70% of the time, then we would actually expect 3 games where the favorite loses. So it’s not about trying to predict every game correctly, it’s about trying to accurately gage the probability that one team has of beating another.
Last Year’s Model
Last year I used exclusively the LRMC Rankings, and the predictions went quite well. It picked 3 of the 4 final four teams, had Kentucky winning it all, and even showed that Lehigh had a legitimate shot of upsetting Duke (which they did)! And we knew the predictions would be accurate because we tested the model before the tournament.
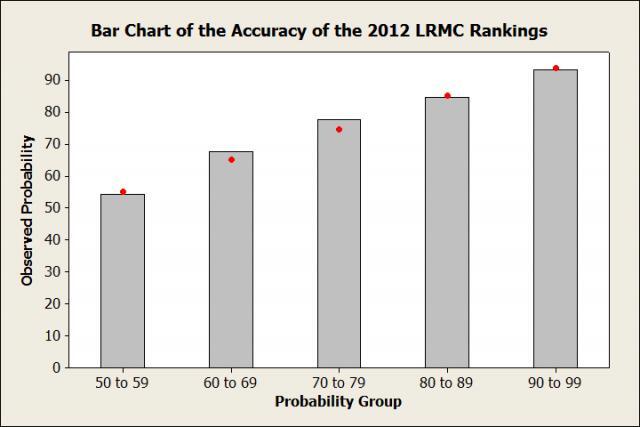
This bar chart shows the predicted and observed probabilities based on last year's LRMC rankings (based on 1,045 games before the tournament). For example, the bar on the far left shows that for all the games in which the LRMC Rankings said the favorite would win between 50% and 59% of the time (there were 190), the favorite won 54.2% of the time. The red dot represents the average probability predicted by the model. In this case it was 55%. So in the 190 games in this category, the model said the favorite would win 55% of them on average, and the teams actually won 54.2%. That’s pretty accurate!
As you look at the other groups, you’ll see that the predicted (bars) and observed probabilities (red dots) are fairly close. So last year there were no worries about using the LRMC Rankings to make predictions in the NCAA tournament. But let’s not rest on our laurels! Instead of blindly using the LRMC Rankings again, let’s be good statisticians and ensure that they’re just as good this year. I’ll make another bar chart for the LRMC rankings using data from this year.
(You can get the worksheet with the data in it here. I've put the summarized data in the first few columns, and the raw data aftewards. Be warned, it's large!)
This Year’s Model
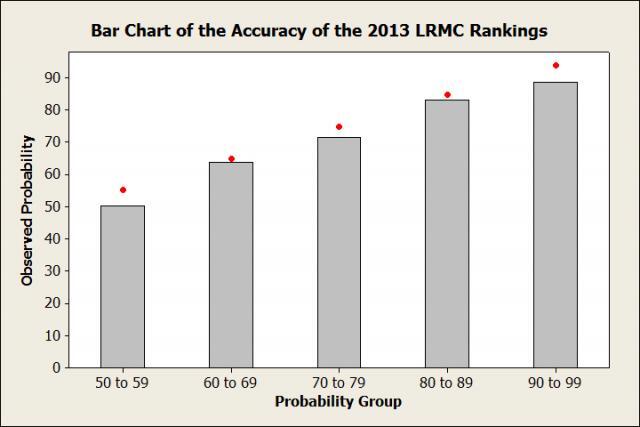
Hmmmm, the red dots don’t seem to be as close to the bars as they were last year. In fact, in games where the LRMC rankings say the favorite should be winning 55% of the time, they’re barley winning half of those games (50.3%)!
So let’s visualize the difference between the two years by plotting the difference between the observed and predicted probabilities for each probability group. More accurate ranking systems will have a smaller difference, so we’re looking for small bars on the next chart.
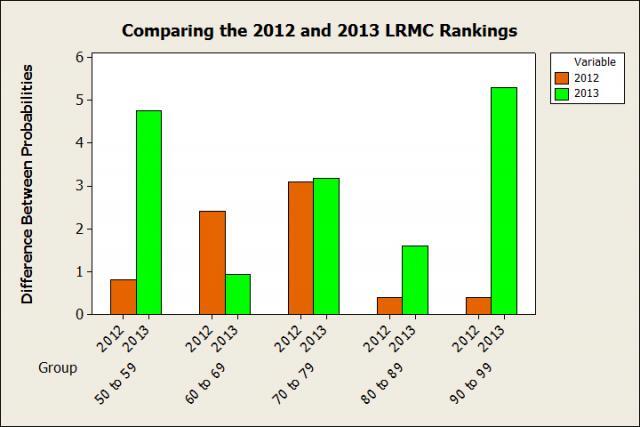
We see that the 2012 LRMC Rankings are superior in 4 of the 5 groups, only losing out in the “60 to 69” group. We also see that in the "90 to 99" group, the 2013 LRMC rankings are off by over 5%!
Now before we start to panic, I should point out that the data from this year are based on fewer games (678 as opposed to 1,045). A smaller sample size leaves more room for more variation. Still, it seems unsettling that the results are so different from last year's. Perhaps we should use a different ranking system! Luckily, as I was tracking the 678 games for the LRMC rankings, I also recorded the rankings from 3 other systems:
- Ken Pomeroy’s College Basketball Ratings
- The Massey Ratings (I used the Power Rating, as they are meant for prediction)
- Jeff Sagarin NCAA Basketball Ratings (again, using the PREDICTOR rankings, as they are meant for prediction)
I would have liked to compare more, but it takes a while to gather all the data. Alas, I had to limit myself to 4. But the good news is that we can now compare all 4 ranking systems on the exact same games. Just like the last Bar Chart, I’ll compare the difference between the predicted and observed observations. May the best ranking system win!
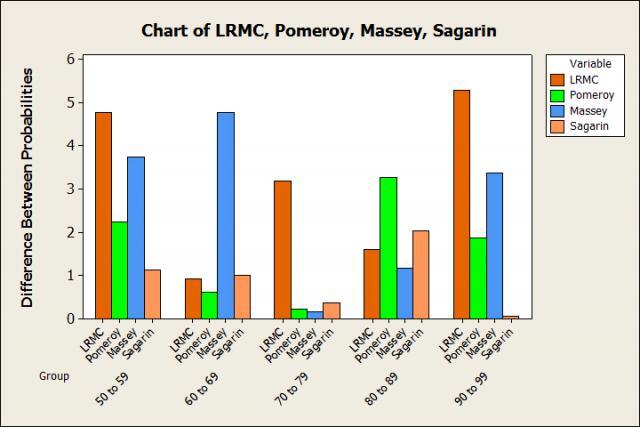
And we have a winner! The Sagarin Ratings have the smallest difference in 2 of the 5 groups, and are just about equal to the smallest difference in 2 others. In addition, 4 of the 5 observed probabilities differ from the predicted probabilities by 1.1% or less! And the 5th group differs by only 2%, which isn't bad at all. The total difference for the Sagarin Ratings across all 5 groups is 4.6%. No other ranking system comes close to that. And in fact, both the LRMC Rankings and Massey Ratings are off by more than 4.6% in a single group!
So now let’s come full circle and plot the observed and predicted probabilities of the favorite winning using the Sagarin ratings.
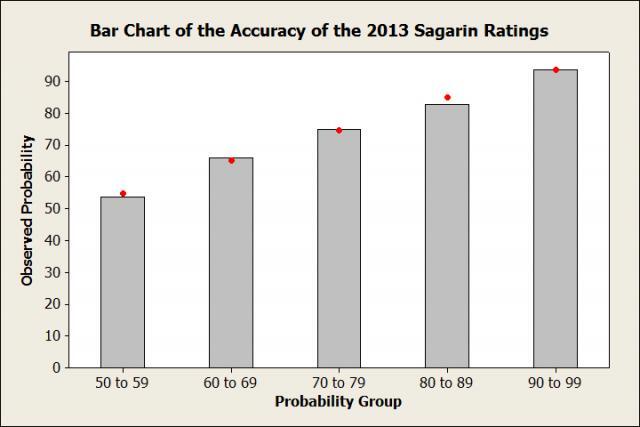
The red dots are a lot closer to the top of the bars here. In fact, the difference between them is less than it was for the 2012 LRMC Rankings! I think we’ve found the rankings that we’re going to use for this year’s NCAA tournament. Make sure to come back Monday, as I’ll use the regression model and the Sagarin Ratings to break down the entire tournament. Until then, let’s look at the current top 5 teams according to the Sagarin Ratings.
#5 Gonzaga
No, they’re not #1 like they are in the human polls, but the Sagarin rankings still have Gonzaga as one of the best teams in the country. And despite their #1 ranking in the human polls, a lot of people don’t believe in the Zags because they play in a weak conference. And while this is true, they are absolutely dominating that weak conference, to a tune of 0.3 points per possession. If you’re not familiar with efficiency numbers, that’s a lot. In fact, it’s higher than the amount of points per possession the 2007-08 Memphis Tigers outscored their weak conference by. And that Memphis team came within a Mario Chambers 3 pointer of winning the national championship. So while I’m not saying Gonzaga is destined for the championship game, I am saying that thinking they’re overrated because they play in a weak conference is folly.
#4 Duke
This Duke team is going to be a hard one to judge. The main problem with the Sagarin Ratings (or any computer based ranking system) is that they can’t account for injuries. So that means about half of the data for Duke comes in games played without Ryan Kelly. Even so, they still are ranked #4, showing that they are a great team. But how much higher would they be if Kelly was healthy all season? Most people are assuming they’d be #1. And yes, they did look mighty impressive with Kelly in their win at North Carolina. But before that, they only beat Miami by 3 points at home (even with 36 points from Kelly) and struggled for a half against a bad Virginia Tech team. A few more games in the ACC tournament will definitely be helpful to try and gauge just how good this team is.
#3 Louisville
A three-game skip in January made everybody jump off the Louisville bandwagon. But now it seems everybody is hoping back on as the Cardinals have won 11 of their last 12 games. And really, they should never have jumped off. This Louisville team definitely has the talent to return to the Final Four this year. They play suffocating defense and have the best player that nobody seems to be talking about in Russ Smith. In fact, Smith is so good that he’s currently the leading candidate for Ken Pomeroy’s Player of the Year. This will be a dangerous team in the tournament.
#2 Indiana
It shouldn’t be much of a surprise to see the best team in the Big 10 ranked so high. In a season where college basketball might have its lowest scoring season since 1952, Indiana has done its best to boost scoring, running the most efficient offense in college basketball. We should all be rooting for Indiana to go far in the tournament, if for no other reason than to make sure we don’t get stuck watching a 48-44 Final Four game. With their high scoring offense, Indiana games are anything but boring.
#1 Florida
Yup, you read that right. The Sagarin Ratings (and most other computer ranking systems) have the Gators at #1. The reason is because Florida just blows everybody out. And when they haven’t blown people out, they’ve been unlucky, going 0-4 in games decided by 2 possessions or less. This has led to numerous sports analysts claiming that Florida “doesn’t know how to win close games” and is “unclutch.” But the statistics show that the outcome in close games has more to do with randomness (luck) than it has to with either team being clutch or unclutch. For example, in 2011 Kentucky went 1-5 in games decided by 1 possession or less. People again said they didn’t know how to win in the clutch. But all that really happened was Kentucky’s unluckiness created a very underrated 4 seed that ended up going to the Final Four. And in the tournament, they won not only one, but two 1 possession games! How did they all of the sudden learn to be clutch!?!?!?!?!?!
At the moment Florida is projected to get a 2 or even a 3 seed. If that happens, it’s going to create a very unhappy 1 seed for whoever gets put in their region.