


One highlight of writing for and editing the Minitab Blog is the opportunity to read your responses and answer your questions. Sometimes, to my chagrin, you point out that we've made a mistake. However, I'm particularly grateful for those comments, because it permits us to correct inadvertent errors.
I feared I had an opportunity to fix just such an error when I saw this comment appear on one of our older blog posts:You said a p-value greater than 0.05 gives a good fit. However, in another post, you say the p-value should be below 0.05 if the result is significant. Please, check it out!
You ever get a chill down your back when you realize you goofed? That's what I felt when I read that comment. Oh no, I thought. If the p-value is greater than 0.05, the results of a test certainly wouldn't be significant. Did I overlook an error that basic?
Before beating myself up about it, I decided to check out the posts in question. After reviewing them, I realized I wouldn't need to put on the hairshirt after all. But the question reminded me about the importance of a fundamental idea.
It Starts with the Hypothesis
If you took an introductory statistics course at some point, you probably recall the instructor telling the class how important it is to formulate your hypotheses clearly. Excellent advice.
However, many commonly used statistical tools formulate their hypotheses in ways that don't quite match. That's what this sharp-eyed commenter noticed and pointed out.
The writer of the first post detailed how to use Minitab to identify the distribution of your data, and in her example pointed out that a p-value greater than 0.05 meant that the data were a good fit for a given distribution. The writer of second post—yours truly—commented on the alarming tendency to use deceptive language to describe a high p-value as if it indicated statistical significance.
To put it in plain language, my colleague's post cited the high p-value as an indicator of a positive result. And my post chided people who cite a high p-value as an indicator of a positive result.
Now, what's so confusing about that?
Don't Forget What You're Actually Testing
You can see where this looks like a contradiction, but to my relief, the posts were consistent. The appearance of contradiction stemmed from the hypotheses discussed in the two posts. Let's take a look.
My colleague presented this graph, output from the Individual Distribution Identification:
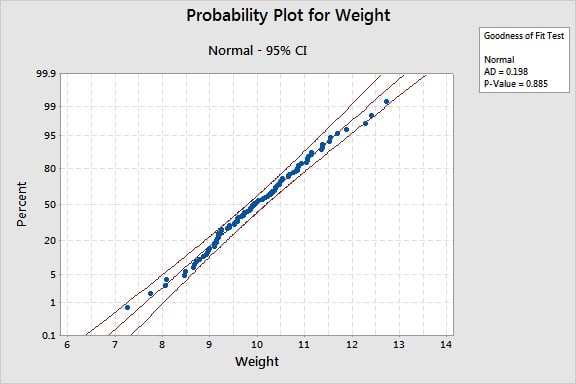
The individual distribution identification is a kind of hypothesis test, and so the p-value helps you determine whether or not to reject the null hypothesis.
Here, the null hypothesis is "The data follow a normal distribution," and the alternative hypothesis would be "The data DO NOT follow a normal distribution." If the p-value is over 0.05, we will fail to reject the null hypothesis and conclude that the data follow the normal distribution.
Just have a look at that p-value:
That's a high p-value. And for this test, that means we can conclude the normal distribution fits the data. So if we're checking these data for the assumption of normality, this high p-value is good.
But more often we're looking for a low p-value. In a t-test, the null hypothesis might be "The sample means ARE NOT different," and the alternative hypothesis, "The sample means ARE different." Seen this way, the value or arrangement of the hypotheses is the opposite of that in the distribution identification.
Hence, the apparent contradiction. But in both cases a p-value greater than 0.05 means we fail to reject the null hypothesis. We're interpreting the p-value in each test the same way.
However, because the connotations of "good" and "bad" are different in the two examples, how we talk about these respective p-values appears contradictory—until we consider exactly what the null and alternative hypotheses are saying.
And that's a point I was happy to be reminded of.