


When it comes to creating control charts, it's generally good to collect data in subgroups, if possible. But sometimes gathering subgroups of measurements isn't an option. Measurements may be too expensive. Production volume may be too low. Products may have a long cycle time.
In many of those cases, you can use an I-MR chart. Like all control charts, the I-MR chart has three main uses:
- Monitoring the stability of a process.
Even very stable processes have some variation, and when you try to fix minor fluctuations in a process you can actually cause instability. An I-MR chart can alert you to changes that reveal a problem you should address.
- Determining whether a process is stable and ready to be improved.
When you change an unstable process, you can't accurately assess the effect of the changes. An I-MR chart can confirm (or deny) the stability of your process before you implement a change.
- Demonstrating improved process performance.
Need to show that a process has been improved? Before-and-after I-MR charts can provide that proof.
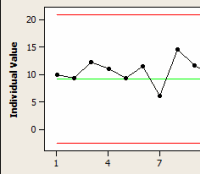
The I-MR is really two charts in one. At the top of the graph is an Individuals (I) chart, which plots the values of each individual observation, and provides a means to assess process center.
The bottom part of the graph is a Moving Range (MR) chart, which plots process variation as calculated from the ranges of two or more successive observations.
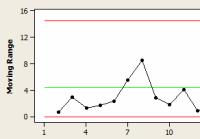
The green line on each chart represents the mean, while the red lines show the upper and lower control limits. An in-control process shows only random variation within the control limits. An out-of-control process has unusual variation, which may be due to the presence of special causes.
Creating the I-MR Chart
Let's say you work for a chemical company, and you need to assess whether the pH value for a custom solution is within acceptable limits. The solution is made in batches, so you can only take one pH measurement per batch and the data cannot be subgrouped. This is an ideal situation for an I-MR chart.
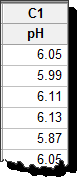
So you measure pH for 25 consecutive batches. Preparing this data for the I-MR chart couldn't be easier: just list your measurements in a single column, in the order you collected them. (To follow along, please download this data set and, if you don't already have it, the free trial of our statistical software.)
Choose Stat > Control Charts > Variables Charts for Individuals > I-MR and select pH as the Variable. If you enter more than one column in Variables, no problem -- Minitab will simply produce multiple I-MR charts. Dialog box options let you add labels, split the chart into stages, subset the data , and more.
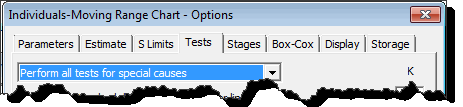
You're want to catch any possible special cause of variation, so click I-MR Options, and then choose Tests. Choose "Perform all tests for special causes," and then click OK in each dialog box.
The tests for special causes detect points beyond the control limits and specific patterns in the data.
- When an observation fails a test, Minitab reports it in the Session window and marks it on the I chart. A failed point indicates a nonrandom pattern in the data that should be investigated.
- When no points are displayed under the test results, no observations failed the tests for special causes.
Interpreting the I-MR Chart, part 1: The MR Chart
Here's the I-MR chart for your pH data:
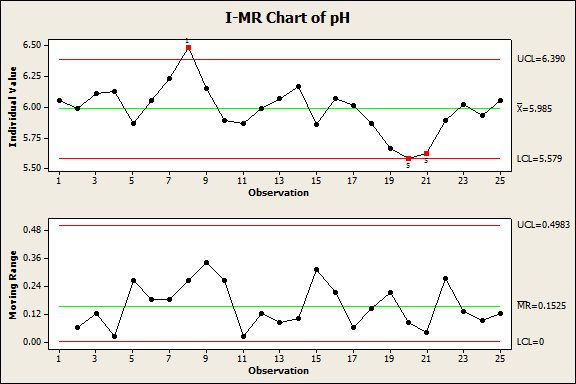
First examine the MR chart, which tells you whether the process variation is in control. If the MR chart is out of control, the control limits on the I chart will be inaccurate. That means any lack of control in the I chart may be due to unstable variation, not actual changes in the process center. If the MR chart is in control, you can be sure that an out-of-control I chart is due to changes in the process center.
Points that fail Minitab's tests are marked with a red symbol on the MR chart. In this MR chart, the lower and upper control limits are 0 and 0.4983, and none of the individual observations fall outside those limits.The points also display a random pattern. So the process variation is in control, and it is appropriate to examine the I Chart.
Interpreting the I-MR Chart, part 2: The I Chart
The individuals (I) chart assesses whether the process center is in control. Unfortunately, this I chart doesn't look as good as the MR chart did:
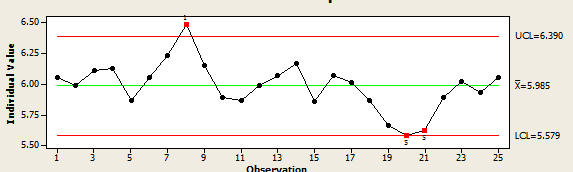
Minitab conducts up to eight special-cause variation tests for the I chart, and marks problem observations with a red symbol and the number of the failed test. The graph tells you three observations failed two tests. The Minitab Session Window tells you why each point was flagged:
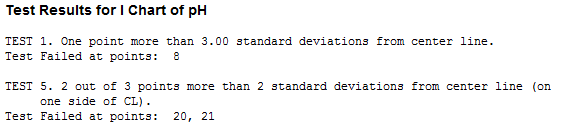
Observation 8 failed Test 1, which tests for points more than 3 standard deviations from the center line -- the strongest evidence that a process is out of control. Observations 20 and 21 failed Test 5, which tests for a run of two out of three points with the same sign that fall more than two standard deviations from the center line. Test 5 provides additional sensitivity for detecting smaller shifts in process mean.
This I-MR chart indicates that the process average is unstable and the process is out of control, possibly due to the presence of special causes.
Now What?
The I-MR chart for pH may not be what you wanted to see, but now you know there may be a problem that needs to be addressed. That's the whole purpose of the control chart! Next, you can try to identify and correct the factors contributing to this special-cause variation. Until these causes are eliminated, the process cannot achieve a state of statistical control.