In the first part of this series, we saw how conflicting opinions about a subjective factor can create business problems. In part 2, we used Minitab's Assistant feature to set up an attribute agreement analysis study that will provide a better understanding of where and when such disagreements occur.
We asked four loan application reviewers to reject or approve 30 selected applications, two times apiece. Now that we've collected that data, we can analyze it. If you'd like to follow along, you can download the data set here.
As is so often the case, you don't need statistical software to do this analysis—but with 240 data points to contend with, a computer and software such as Minitab will make it much easier.
Entering the Attribute Agreement Analysis Study Data
Last time, we showed that the only data we need to record is whether each appraiser approved or rejected the sample application in each case. Using the data collection forms and the worksheet generated by Minitab, it's very easy to fill in the Results column of the worksheet.
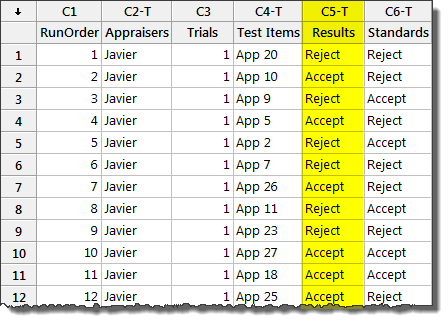
Analyzing the Attribute Agreement Analysis Data
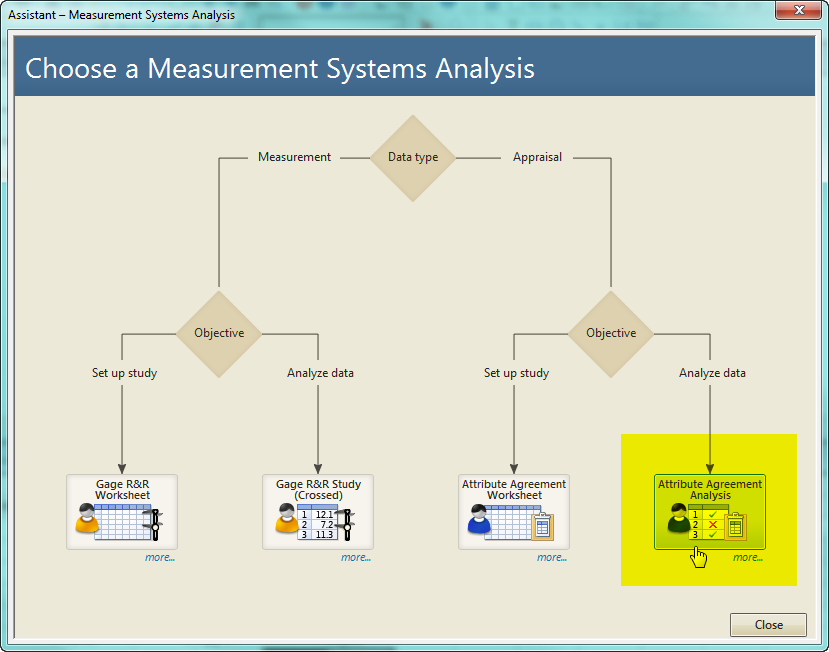
The next step is to use statistics to better understand how well the reviewers agree with each others' assessments, and how consistently they judge the same application when they evaluate it again. Choose Assistant > Measurement Systems Analysis (MSA)... and press the Attribute Agreement Analysis button to bring up the appropriate dialog box:
The resulting dialog couldn't be easier to fill out. Assuming you used the Assistant to create your worksheet, just select the columns that correspond to each item in the dialog box, as shown:
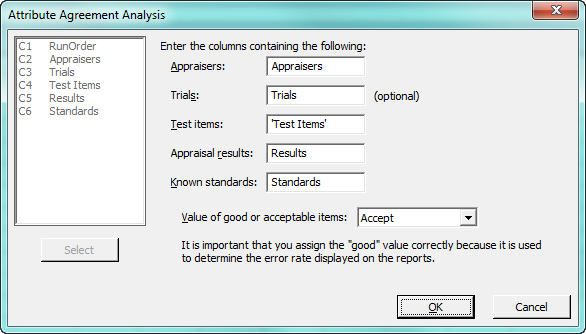
If you set up your worksheet manually, or renamed the columns, just choose the appropriate column for each item. Select the value for good or acceptable items—"Accept," in this case—then press OK to analyze the data.
Interpreting the Results of the Attribute Agreement Analysis
Minitab's Assistant generates four reports as part of its attribute agreement analysis. The first is a summary report, shown below:
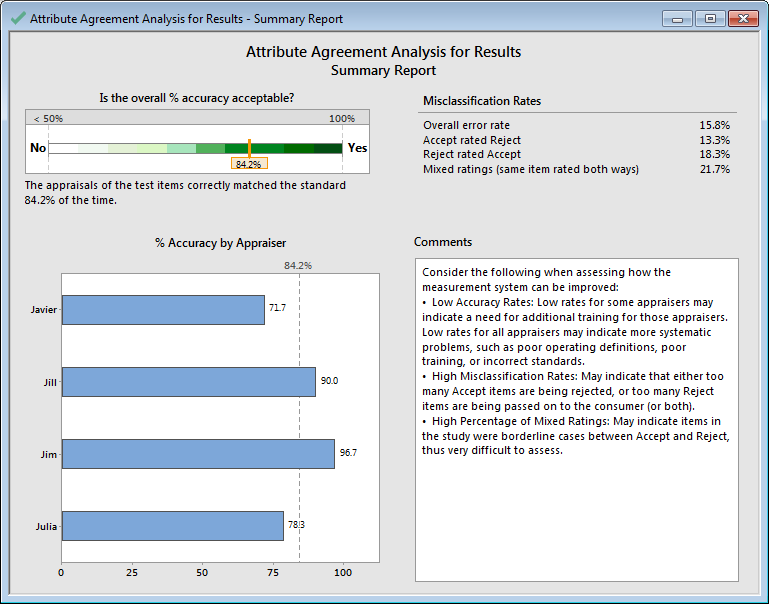
The green bar at top left of the report indicates that overall, the error rate of the application reviewers is 15.8%. That's not as bad as it could be, but it certainly indicates that there's room for improvement! The report also shows that 13% of the time, the reviewers rejected applications that should be accepted, and they accepted applications that should be rejected 18% of the time. In addition, the reviewers rated the same item two different ways almost 22% of the time.
The bar graph in the lower left indicates that Javier and Julia have the lowest accuracy percentages among the reviewers at 71.7% and 78.3%, respectively. Jim has the highest accuracy, with 96%, followed by Jill at 90%.
The second report from the Assistant, shown below, provides a graphic summary of the accuracy rates for the analysis.

This report illustrates the 95% confidence intervals for each reviewer in the top left, and further breaks them down by standard (accept or reject) in the graphs on the right side of the report. Intervals that don't overlap are likely to be different. We can see that overall, Javier and Jim have different overall accuracy percentages. In addition, Javier and Jim have different accuracy percentages when it comes to assessing those applications that should be rejected. However, most of the other confidence intervals overlap, suggesting that the reviewers share similar abilities. Javier clearly has the most room for improvement, but none of the reviewers are performing terribly when compared to the others.
The Assistant's third report shows the most frequently misclassified items, and individual reviewers' misclassification rates:
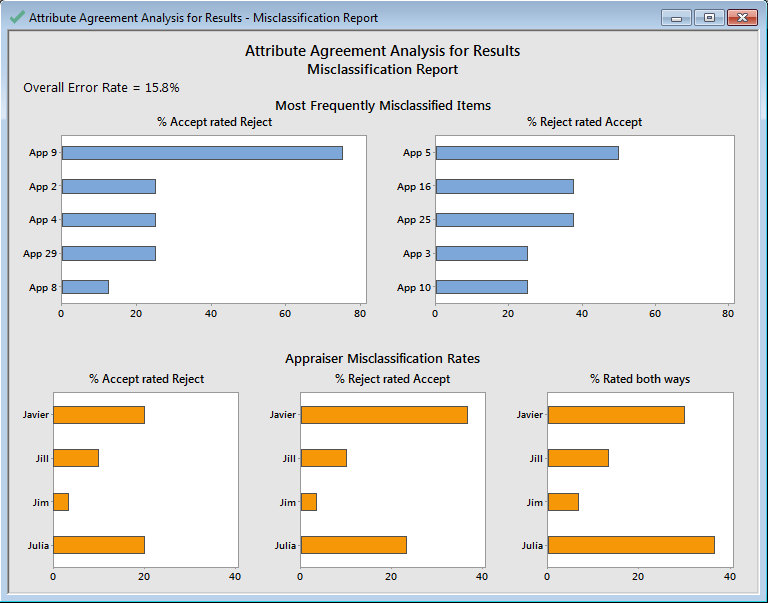
This report shows that App 9 gave the reviewers the most difficulty, as it was misclassified almost 80% of the time. (A check of the application revealed that this was indeed a borderline application, so the fact that it proved challenging is not surprising.) Among the reject applications that were mistakenly accepted, App 5 was misclassified about half of the time.
The individual appraiser misclassification graphs show that Javier and Julia both misclassified acceptable applications as rejects about 20% of the time, but Javier accepted "reject" applications nearly 40% of the time, compared to roughly 20% for Julia. However, Julia rated items both ways nearly 40% of the time, compared to 30% for Javier.
The last item produced as part of the Assistant's analysis is the report card:
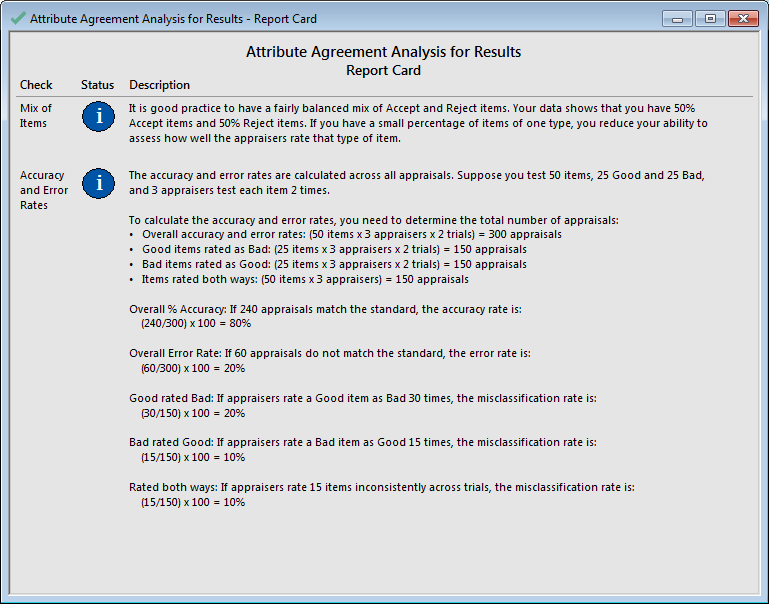
This report card provides general information about the analysis, including how accuracy percentages are calculated. It also can alert you to potential problems with your analysis (for instance, if there were an imbalance in the amount of acceptable to rejectable items being evaluated); in this case, there are no alerts we need to be concerned about.
Moving Forward from the Attribute Agreement Analysis
The results of this attribute agreement analysis give the bank a clear indication of how the reviewers can improve their overall accuracy. Based on the results, the loan department provided additional training for Javier and Julia (who also were the least experienced reviewers on the team), and also conducted a general review session for all of the reviewers to refresh their understanding about which factors on an application were most important.
However, training may not always solve problems with inconsistent assessments. In many cases, the criteria on which decisions should be based are either unclear or nonexistent. "Use your common sense" is not a defined guideline! In this case, the loan officers decided to create very specific checklists that the reviewers could refer to when they encountered borderline cases.
After the additional training sessions were complete and the new tools were implemented, the bank conducted a second attribute agreement analysis, which verified improvements in the reviewers' accuracy.
If your organization is challenged by honest disagreements over "judgment calls," an attribute agreement analysis may be just the tool you need to get everyone back on the same page.


